See also the main article on Texas, for documented election integrity issues and further reports.
Former US military intelligence officer and statistical analyst Seth Keshel analyzed the trends of voter registrations versus actual votes. The following report indicates which counties’ vote counts align with the trend in voter registrations and which have small or large divergences. Each county is flagged as red, yellow, or green, based on whether the 2020 vote totals aligned with the expected trends (as past decades demonstrate they typically do), or if they diverged in statistically unlikely ways.
Texas Overview

| Trump votes | Biden votes | Other votes | |
|---|---|---|---|
| Officially reported results | 5890347 (52.1%) | 5259126 (46.5%) | 158339 (1.4%) |
| Estimate of potential fraud | 675000 (6.0%) | ||
| Estimate of actual result
(with fraud removed) |
5890347 (55.4%) | 4584126 (43.1%) | 158339 (1.5%) |
Estimating 675k excess votes for Biden, conservatively estimated. This would still give him a record high Democrat vote gain, as he was up 1.38 million from Clinton, with Trump also up at a record number 1.21 million. Counties over 50k listed in spreadsheet screenshot.
Since there is no party registration data available, my estimate is based on the 20-year pattern plus political trend. Trump trended Hispanic Texas heavily Republican, but somehow “lost” Tarrant County and lost big margins in suburbs despite huge ~30% gains or more in all of them. Democrat activity is obvious, many suburbs over 60% growth, huge urbans over 40%.
Put simply, massive Trump gains in San Antonio, Fort Worth, and Houston don’t agree historically with a corresponding massive Democrat jump in those counties.
If accurate on 675k excess Biden votes, Trump margin should have been roughly 55.4 to 43.1 (12.3%) with a margin of 1.3 million votes instead of 631k.
Best targets for audits (Republican-led): Tarrant, Collin, Denton, Wichita, Taylor, Bell
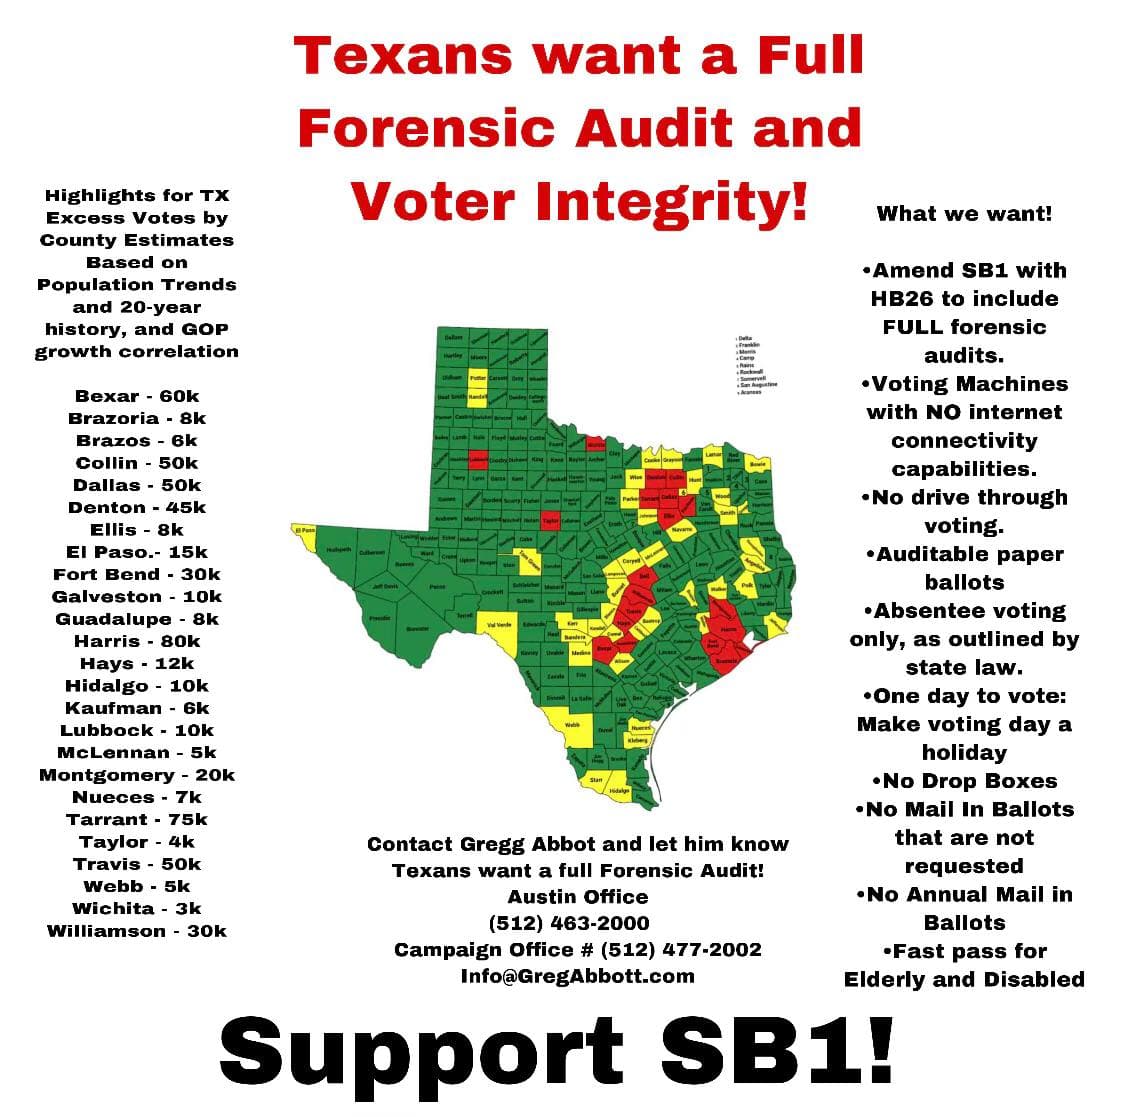
Estimates of Excess Votes by County
Based on Population Trends and 20-year history, and GOP growth correlation:
| Bexar | 60k |
| Brazoria | 8k |
| Brazos | 6k |
| Collin | 50k |
| Dallas | 50k |
| Denton | 45k |
| Ellis | 8k |
| El Paso | 15k |
| Fort Bend | 30k |
| Galveston | 10k |
| Guadalupe | 8k |
| Harris | 80k |
| Hays | 12k |
| Hidalgo | 10k |
| Kaufman | 6k |
| Lubbock | 10k |
| McLennan | 5k |
| Montgomery | 20k |
| Nueces | 7k |
| Tarrant | 75k |
| Taylor | 4k |
| Travis | 50k |
| Webb | 5k |
| Wichita | 3k |
| Williamson | 30k |
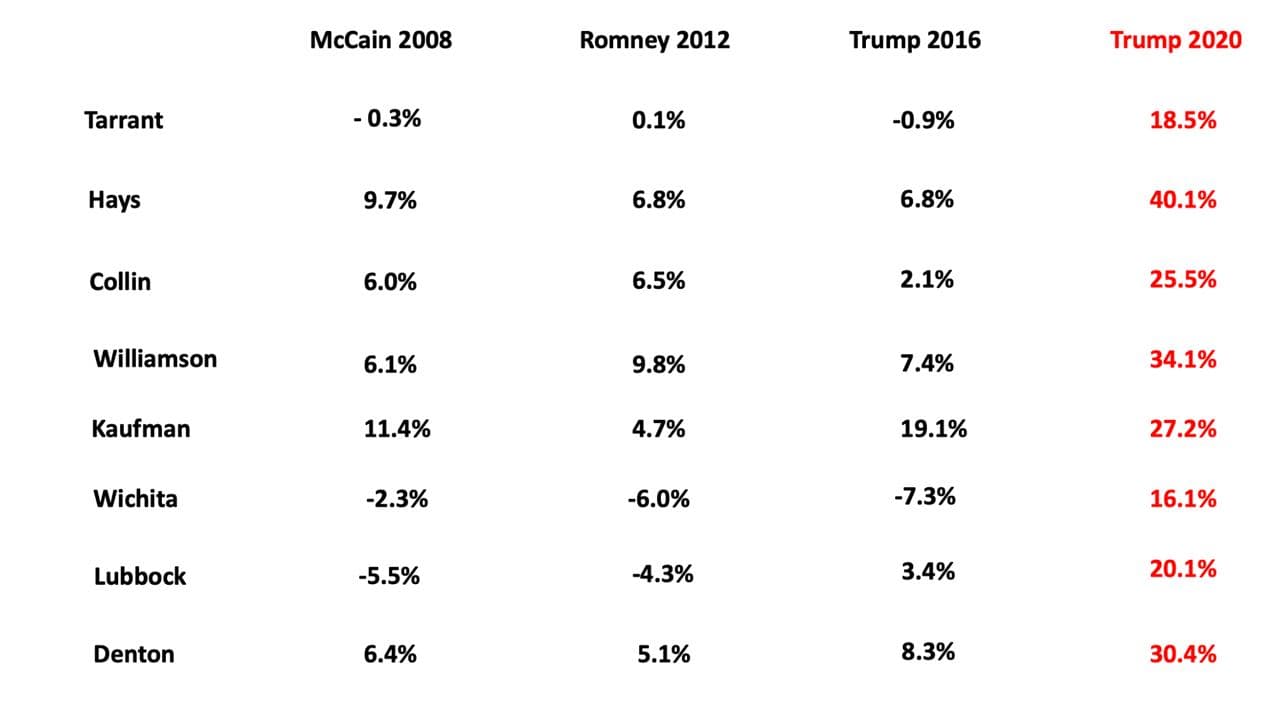
The following chart displays how in 12 Texas counties that voted Republican in 2016, Trump made large gains in votes of between 16 and 41% over the previous election, and yet Biden somehow swept in and increased his overall votes by a whopping 42 to 74% in a single election cycle, flipping these 12 to blue. Does this seem realistic?
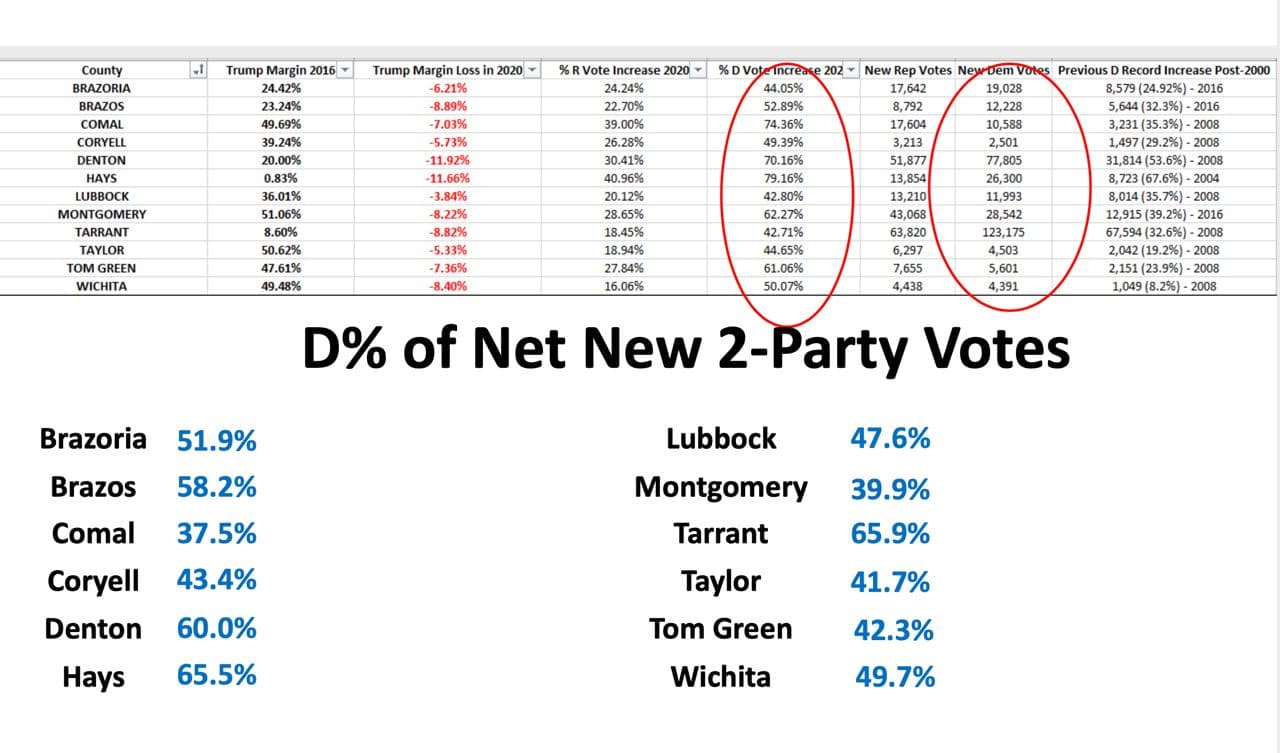
Source: https://t.me/CaptainKMapsandStats/66
Many months later, Seth’s estimates on excess votes matched almost exactly with preliminary results from an election audit in Texas.
Stats By County
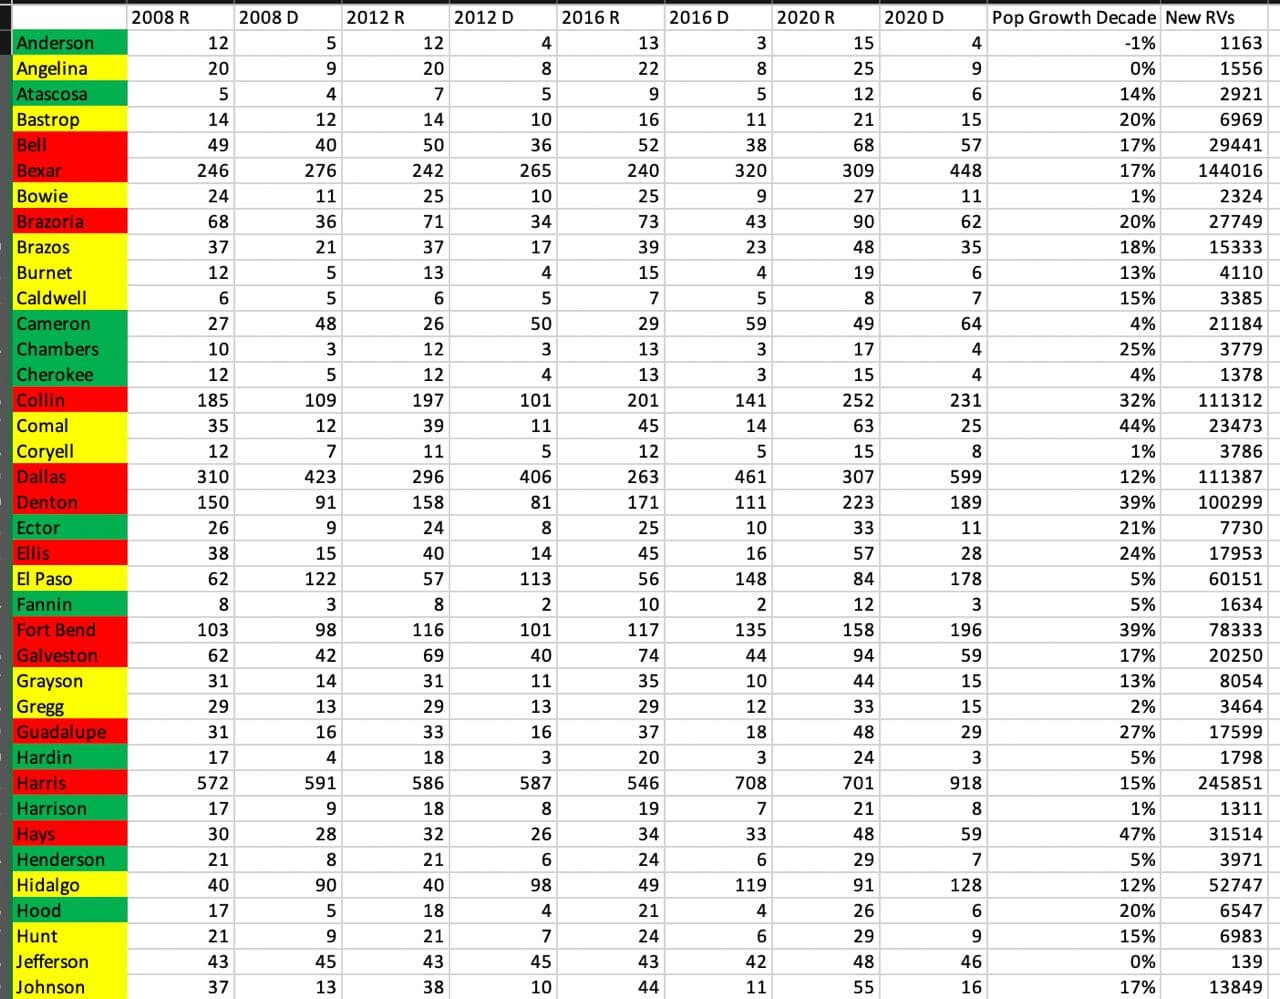
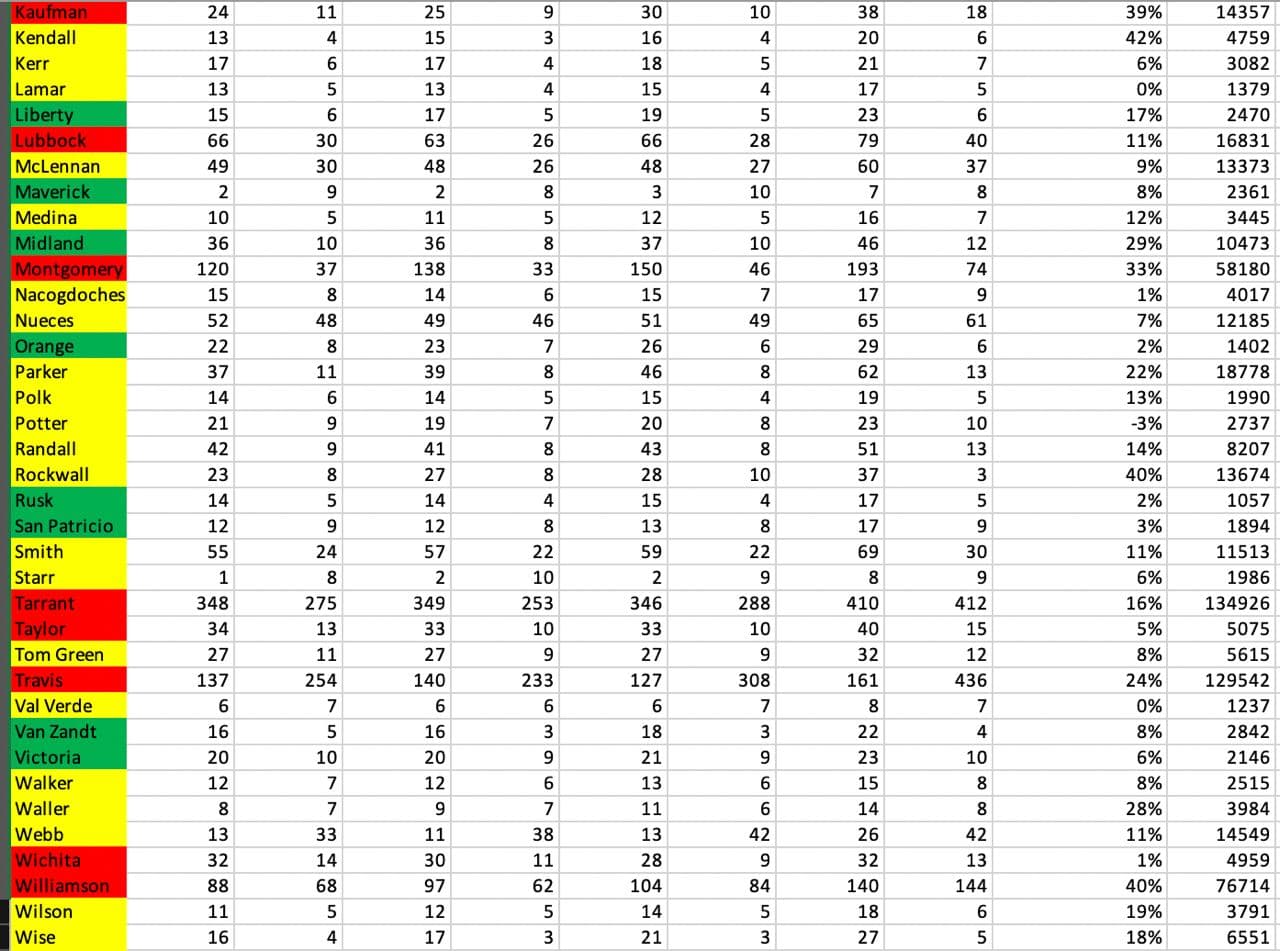
Source: https://t.me/CaptainKMapsandStats/66
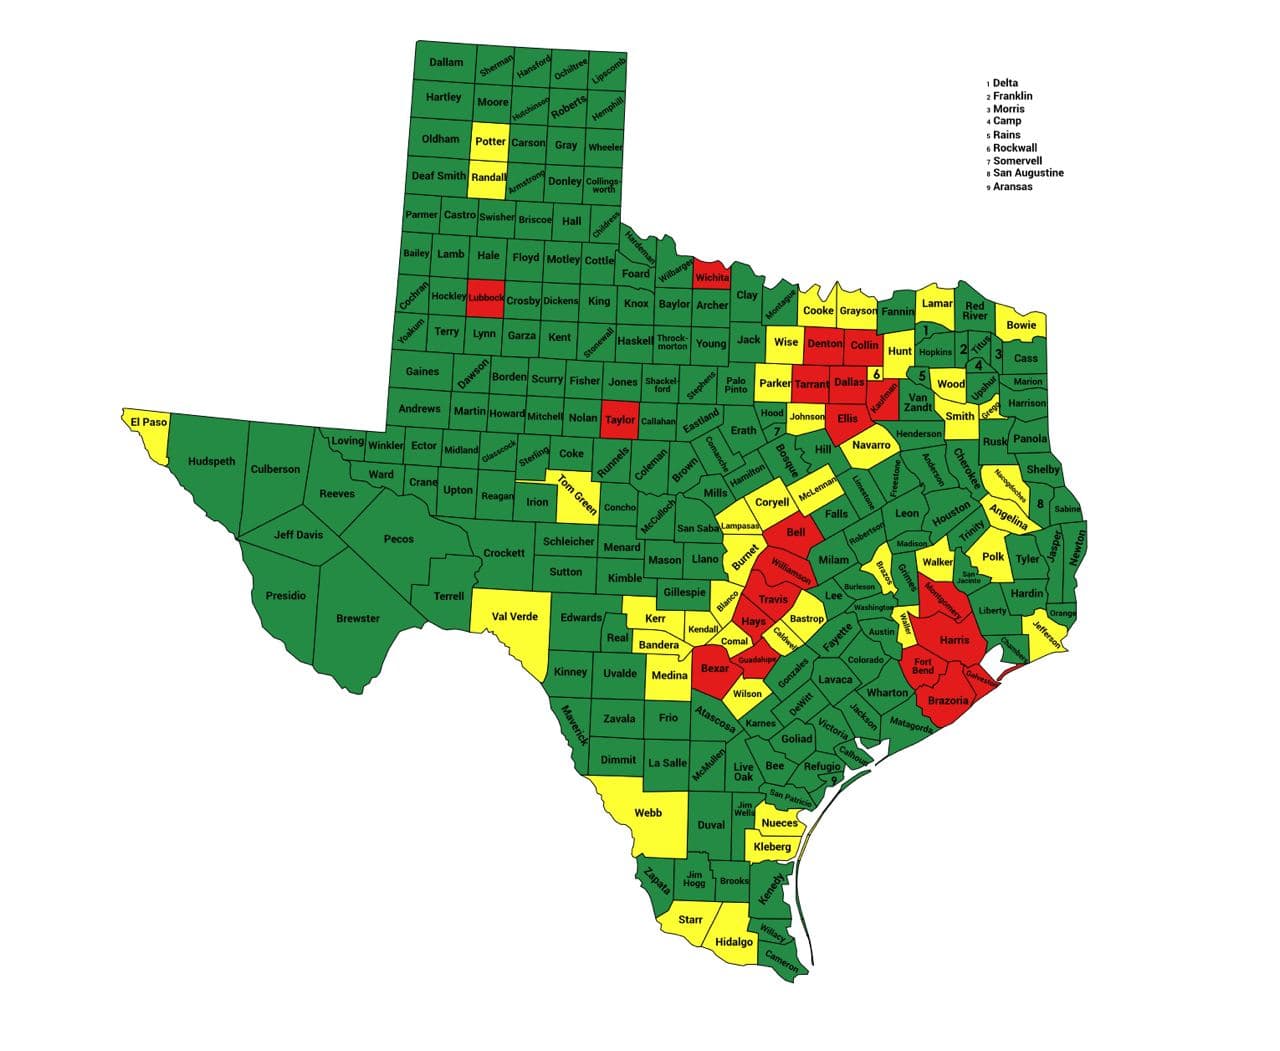
County Party Leanings
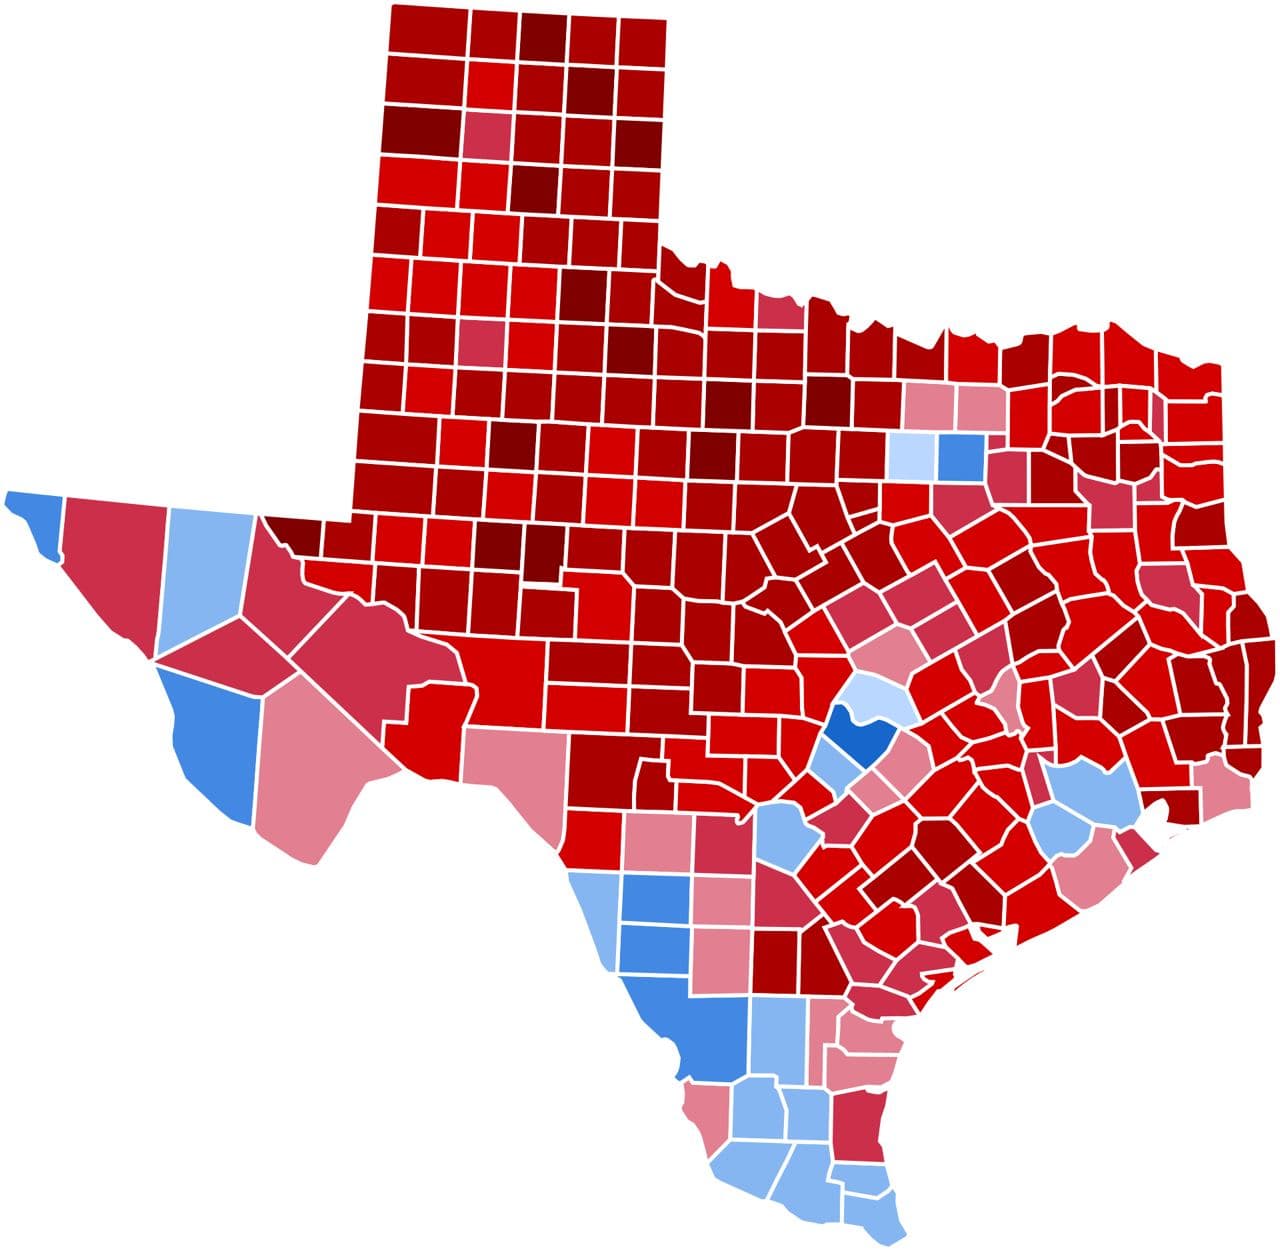
The following map shows the party leanings of each Texas county, first from the “official” certified results:
And now adjusted with Seth’s analysis and heat map:
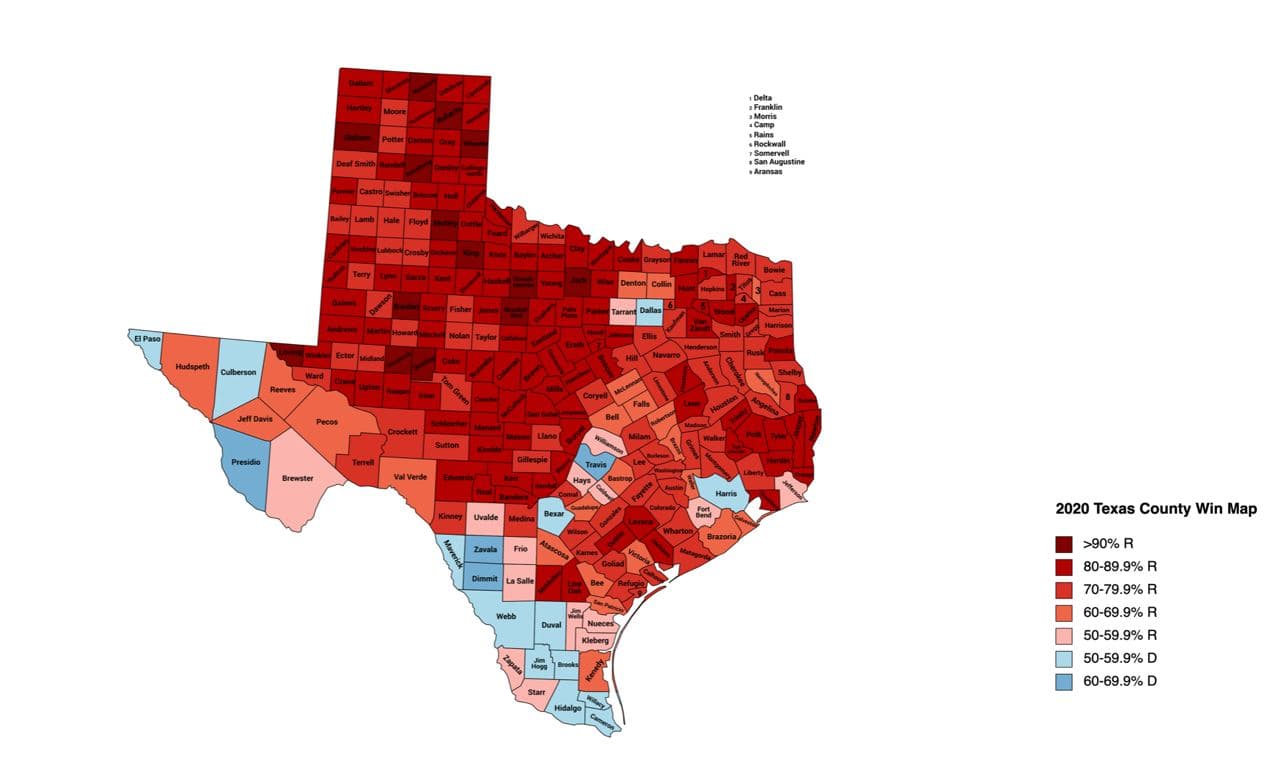
Source: Telegram Post, Dec 19, 2021
Top 100 Worst Counties
Seth has listed Texas’s Bexar, Collin, Dallas, Denton, Harris, Tarrant, and Travis counties as being among the Nation’s Top 100 Worst Counties in terms of abnormal trends during the 2020 election.
Seth’s Presentation to Tarrant County
Here is the complete presentation from July 29, 2021 in Dallas/Fort Worth. National focus followed by Texas focus, followed by action items for believers.
GOP Nominee Vote Growth
I enjoyed this slide the other day - I hadn’t made it until I was thinking of a more effective way to present Trump’s Texas performance.
Everyone knows about the trend with the Hispanic working class, with El Paso, West Texas, South Texas all trending heavily Republican, some counties more than 30%.
As an analyst, validity must be given to the final outcome - if real, then a 5.6% statewide margin and the closest popular vote finish in 24 years has to come from somewhere.
The TX GOP has been upheld by the suburban counties being heavily Republican. So did Trump lose the white vote? THIS IS PERCENTAGE OF VOTES GAINED OVER PREVIOUS ELECTION.
You tell me - here are the two RINOs after Bush (who won TX by a mile), Trump 1.0 with his Cruz grudge in 2016 (9% win)… and now Trump 2020, in major GOP suburbs/counties.”
Follow-Up
Some people asked for more clarity on this forwarded post/graphic. Happy to oblige.
With Trump’s known improvements with Hispanics in TX, including in major metros, the only possible way for the margin to tighten by 3.5% from 2016, and to have the popular vote win shrink by 200,000, is to get clobbered in the suburbs.
This graphic shows GOP nominee vote growth % from previous election. RINOs McCain and Romney are either down, flat, or modestly gaining in population boom counties in 2008-12 and Trump had a third party throwaway/Cruz grudge problem in 2016.
Look at the final column to see the Trump % vote gain and see how impossible it is for Democrats to eat up so much ground in the suburbs.
“But they’re growing!”
They have been large for a long time, and have been growing for decades, with no sudden Democrat boom to counter an historic GOP vote gain boom.
Make sense? See below forwarded message.”
Source: https://t.me/ElectionHQ2024/682
Tarrant County
When the Presidential Election is the Odd One Out
Here is a comparison of 27 election races in Tarrant County, Texas. When every other election swung to Republicans, how likely is it that the 2020 Presidential election should be the only one to turn blue?
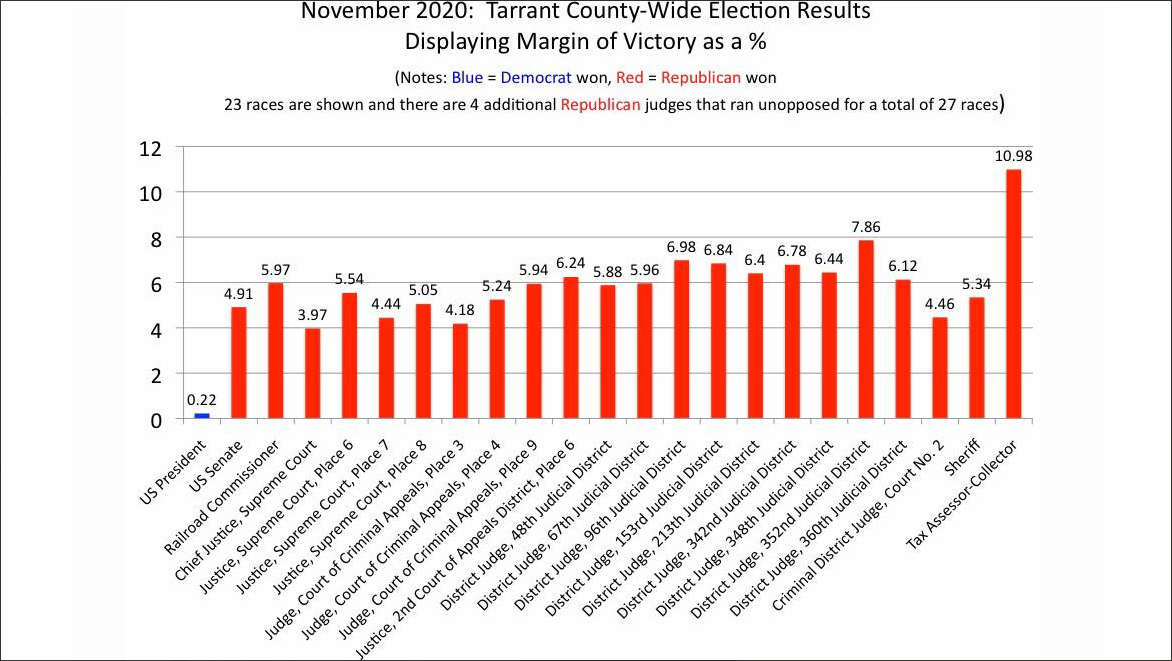
Source: https://t.me/ElectionHQ2024/974 and here
Tarrant Precinct Heat Map
The following PDF shows a map of which precincts in the county had the most abnormal results in 2020:
Dallas Fort Worth Counties Combined
Bastrop County
Bell County
Bexar County
Cameron County
Collin County
Dallas County
Denton County
Ellis County
El Paso County
Fort Bend County
Gillespie County
Harris County
Hays County
Henderson County
Hidalgo County
Lubbock County
Source: Telegram Post, Oct 26, 2021
Nueces County
Parker County
Randall County
Tom Green County
Travis County
Williamson County
Our team here at ElectionFraud20.org has also analyzed some additional stats for Williamson County, being discussed in our Gitlab discussion area:
Wichita County
Seth calls it the biggest layup in the state for spotting excess Biden votes, and explains why with 32 years of information.
Source: Telegram Post, Sep 7, 2021
The Texas Sponge Map
Possible Voter Roll Manipulation
A number of states, both key competitive states, and not, have machined/trimmed/manipulated their voter rolls for the desired outcomes. See New Hampshire, Alaska, California, and Arizona.
There are other states with bloated rolls, like Florida and Texas. Colorado doesn’t show much movement in the two parties but tons of new registered indies/others, along with Washington and Oregon. Pennsylvania and North Carolina appear to have let their party rolls run clean, showing a tremendous beating getting ready to be done by Trump, but pulled things off differently.
Phantoms.
Source: https://t.me/ElectionHQ2024/788
Why Are Audits So Important In Texas?
Seth explains on Bannon’s War Room, Sep 13, 2021:
He also provided an update on the so-called “full forensic audits” in Dallas, Harris, Collin and Tarrant Counties. According to Seth “those audits don’t ‘cut the mustard’ … Don’t get too excited about them.” He also announces that he’s decided not to run for office in Texas:
Source: Telegram post, Sep 30, 2021
Here’s the link to the OAN interview with Steve Toth that Seth referred to in the above video.
Preliminary Texas Audit Results
Seth’s original prediction of 675,000 excess votes was further validated in Jan 2022 with the release of preliminary audit findings in Texas:
Events & Presentations
| Date | Presenter | Location | Link |
|---|---|---|---|
| Sat Feb 26, 2022 | Seth Keshel |
Midland, Texas | More info |
| Sat Feb 12, 2022 | Professor David Clements, Dr. Doug Frank, Seth Keshel, and Jarrin Jackson |
Austin, Texas | More info |
| Mon Dec 13, 2021 | Seth Keshel |
San Antonio/Kerrville Hill Country, Texas | More info |
| Tue Dec 7, 2021 | Seth Keshel |
Houston, Texas | More info |
| Sun Nov 14, 2021 | Gen. Michael Flynn, Dr. Douglas Frank, Seth Keshel, Professor David Clements, and Mike Lindell |
Georgetown, Texas | More info |
| Mon Oct 4, 2021 | Seth Keshel and Honorable Weston Martinez |
Fort Bend, Houston, Texas | More info |
| Mon Sep 27, 2021 | Seth Keshel and others |
Fort Worth, Texas | More info |
| Sat Sep 18, 2021 | Seth Keshel, Dr. Douglas Frank, David Clements, and many others |
Dallas, Texas | More info |
| Sat Aug 28, 2021 | Chairman of County Republican Party Public Forum |
Williamson County | |
| Wed Aug 25, 2021 | Seth Keshel |
Austin, Texas | More info |
Support the Audit
Methodology
Seth Keshel’s estimates are based on the percentage of voters who are registered to each party (where it’s possible to obtain this information) compared to the actual votes for each party. He examined these party trends over the last two decades, as well as population growth, which brought to light the strange and statistically unlikely outliers and anomalies that occurred in 2020. We explain this process, step by step, with visual examples, in our guide How to Predict Election Results Using Registration Data, so that you can investigate the numbers for yourself.
This video from Telegram also explains some of Seth’s approach to analyzing precincts.
Raw Data
We aim to publish links to both the raw election data and voter registration data for Texas so that citizens and researchers can analyze this information for themselves.
Response from Texas Officials
According to Seth (here), he has been in contact with Former Senator and Governor-candidate Don Huffines and Republican Party Chairman Allen West who have been willing to discuss Seth’s analysis and calls for audits.
Governor Greg Abbott has so far been unresponsive.
Other Reports
-
A team of scientists from Election-Integrity.info produced the report “2020 Presidential Election Contrast Analysis” which includes a section on Texas
-
Dallas, Texas 2020 Election Fingerprints, by wwrkds
Further Updates
Election Audit Groups on Telegram
Further updates from Seth Keshel can be found on his Telegram Channel @ElectionHQ2024.
To join the grassroots efforts in pursuing election integrity and audits of the 2020 election in Texas, you can join the following groups on Telegram:
- Audit Texas
- Texas Audit Force
- Texas Audit Force Discussion
- Texas One Six (helping Jan 6 political prisoners)
- Texas One Six Discussion (helping Jan 6 political prisoners)
For other states, see our Full List of Telegram Channels.
ElectionFraud20.org and Seth Keshel have no affiliation with nor any responsibility for these channels. Discern carefully, as some users and even admins of channels have shown obstruction to transparent audits of our elections.