See also the main article on Colorado, for documented election integrity issues and further reports.
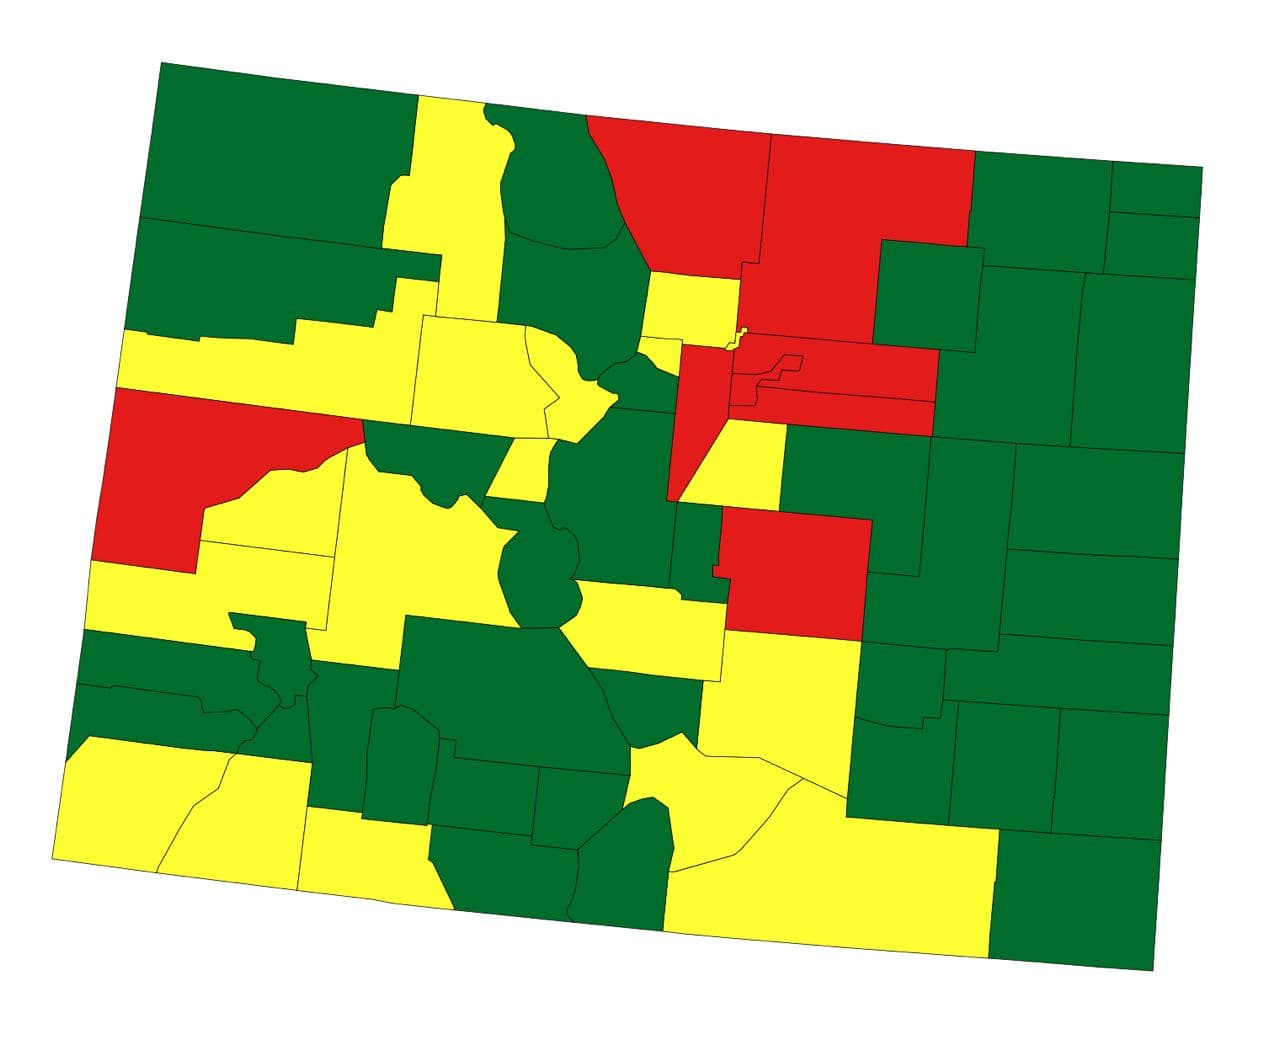
Former US military intelligence officer and statistical analyst Seth Keshel analyzed the trends of voter registrations versus actual votes. The following report indicates which counties’ vote counts align with the trend in voter registrations and which have small or large divergences. Each county is flagged as red, yellow, or green, based on whether the 2020 vote totals aligned with the expected trends (as past decades demonstrate they typically do), or if they diverged in statistically unlikely ways.

| Trump votes | Biden votes | Other votes | |
|---|---|---|---|
| Officially reported results | 1364607 (41.90%) | 1804352 (55.40%) | 87938 (2.7%) |
| Estimate of potential fraud | 183000 (5.6%) | ||
| Estimate of actual result
(with fraud removed) |
1364607 (44.4%) | 1621352 (52.7%) | 87938 (2.9%) |
The increasing trend of Democrat registrations favors a Biden win; however, massive increases in voter rolls like in Oregon with unaffiliated party voters is curious. Biden is +465k in a small state over Clinton, with previous high Democrat gain of 287k for Obama (35k and 15k in 2 elections following). Trump is +162k.
Colorado Secretary of State decision to ban audits forced a lot of people to take a good look here, when many weren’t watching it. Biden’s vote totals in a state that already voted by mail anyway make little sense. I estimate 183k excess votes statewide.
| Red | Obviously Ugly | 8 counties |
| Yellow | Suspect/Likely Fraud | 20 counties |
| Green | Clean | 36 counties |
Estimates for excess votes:
| Arapahoe | 20k |
| Denver | 25k |
| El Paso | 20k |
| Jefferson | 25k |
| Larimer | 12k |
| Mesa | 5k |
| Weld | 10k |
Best audit targets are Mesa and Weld.
With excess votes only accounted for, 52.7% to 44.4% (8.3%) is an accurate Biden number in keeping with registration trends. If votes are being flipped, look out. Would have made the Gardner race very tight.
Source: https://t.me/CaptainKMapsandStats/14
Top 100 Worst Counties
Seth has listed Colorado’s Douglas and El Paso counties as being among the Nation’s Top 100 Worst Counties in terms of abnormal trends during the 2020 election.
Stats By County
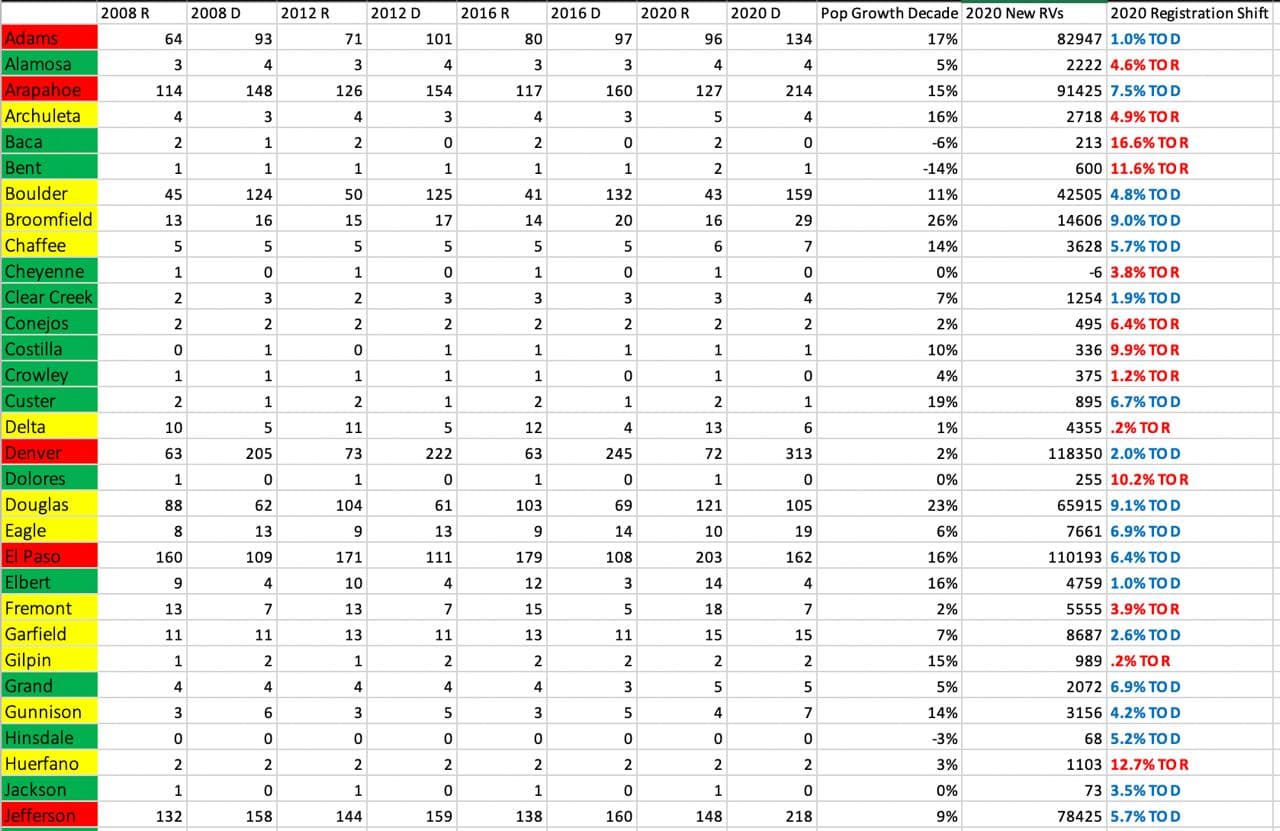
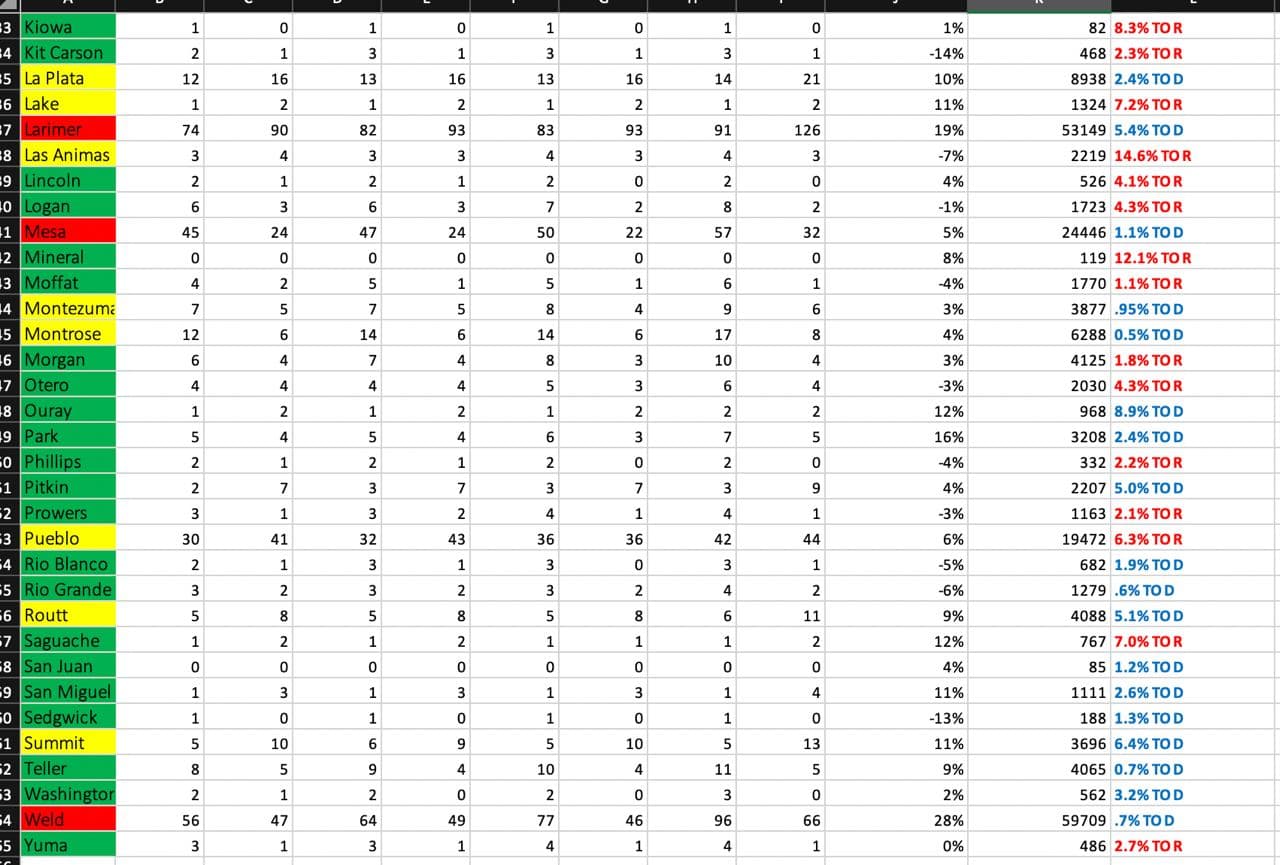
Source: https://t.me/CaptainKMapsandStats/14
Possible Voter Roll Manipulation
A number of states, both key competitive states, and not, have machined/trimmed/manipulated their voter rolls for the desired outcomes. See New Hampshire, Alaska, California, and Arizona.
There are other states with bloated rolls, like Florida and Texas. Colorado doesn’t show much movement in the two parties but tons of new registered indies/others, along with Washington and Oregon. Pennsylvania and North Carolina appear to have let their party rolls run clean, showing a tremendous beating getting ready to be done by Trump, but pulled things off differently.
Phantoms.
Source: https://t.me/ElectionHQ2024/788
This chart shows how the voter rolls tend to increase prior to each election but then drop immediately afterward.
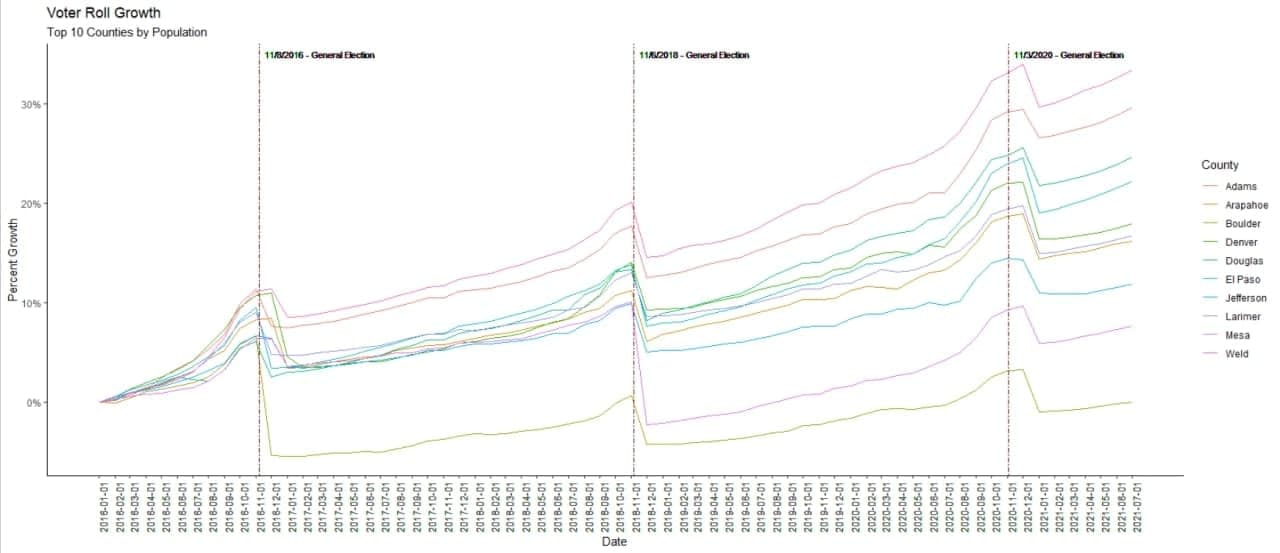
Source: https://t.me/ladydraza/439
Mesa County Deep Dive
Here is the attached video:
Our team at ElectionFraud20.org has also analyzed some additional stats for Mesa County, discussed in our Gitlab discussion area:
Unexpected Surge in Mail-In Ballots
Events & Presentations
| Date | Presenter | Location | Link |
|---|---|---|---|
| Thu Sep 9, 2021 | Seth Keshel |
Greenwood Village, Denver, Colorado | More info |
Methodology
Seth Keshel’s estimates are based on the percentage of voters who are registered to each party (where it’s possible to obtain this information) compared to the actual votes for each party. He examined these party trends over the last two decades, as well as population growth, which brought to light the strange and statistically unlikely outliers and anomalies that occurred in 2020. We explain this process, step by step, with visual examples, in our guide How to Predict Election Results Using Registration Data, so that you can investigate the numbers for yourself.
This video from Telegram also explains some of Seth’s approach to analyzing precincts.
Raw Data
We aim to publish links to both the raw election data and voter registration data for Colorado so that citizens and researchers can analyze this information for themselves.
Election Audit Groups on Telegram
Further updates from Seth Keshel can be found on his Telegram Channel @ElectionHQ2024.
To join the grassroots efforts in pursuing election integrity and audits of the 2020 election in Colorado, you can join the following groups on Telegram:
- Fix 2020 Colorado
- USEIP
- USEIP (Website)
- Colorado Audit Force
- Colorado Audit Force Discussion
- Colorado One Six (helping Jan 6 political prisoners)
- Colorado One Six Discussion (helping Jan 6 political prisoners)
For other states, see our Full List of Telegram Channels.
ElectionFraud20.org and Seth Keshel have no affiliation with nor any responsibility for these channels. Discern carefully, as some users and even admins of channels have shown obstruction to transparent audits of our elections.