See also the main article on North Carolina, for documented election integrity issues and further reports.
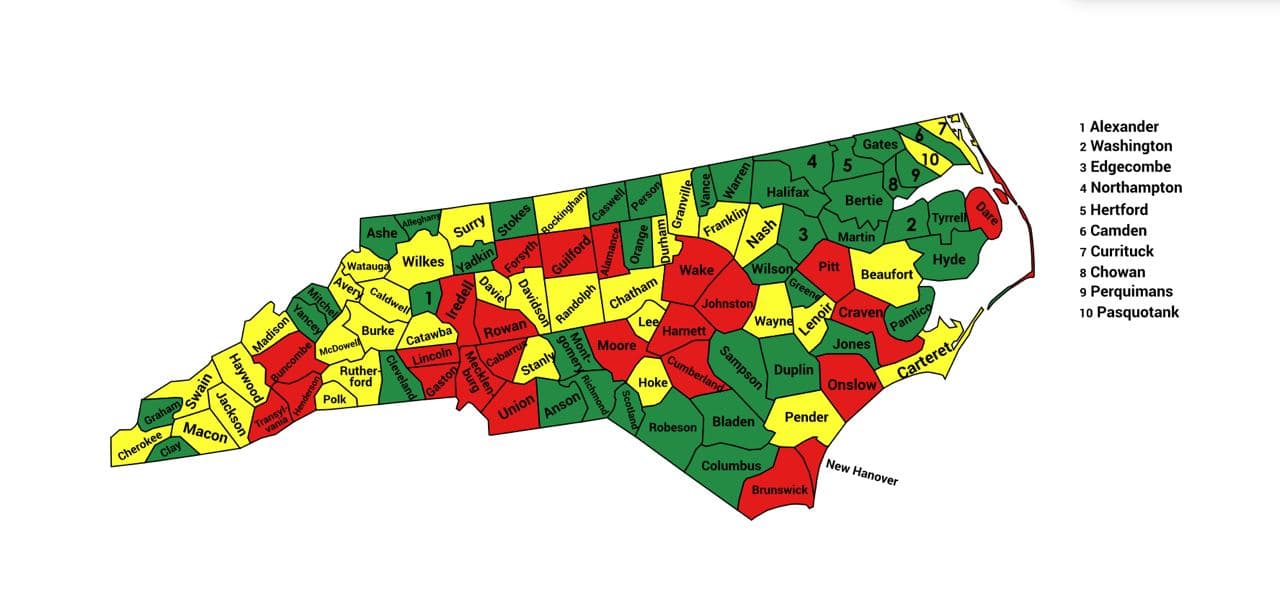
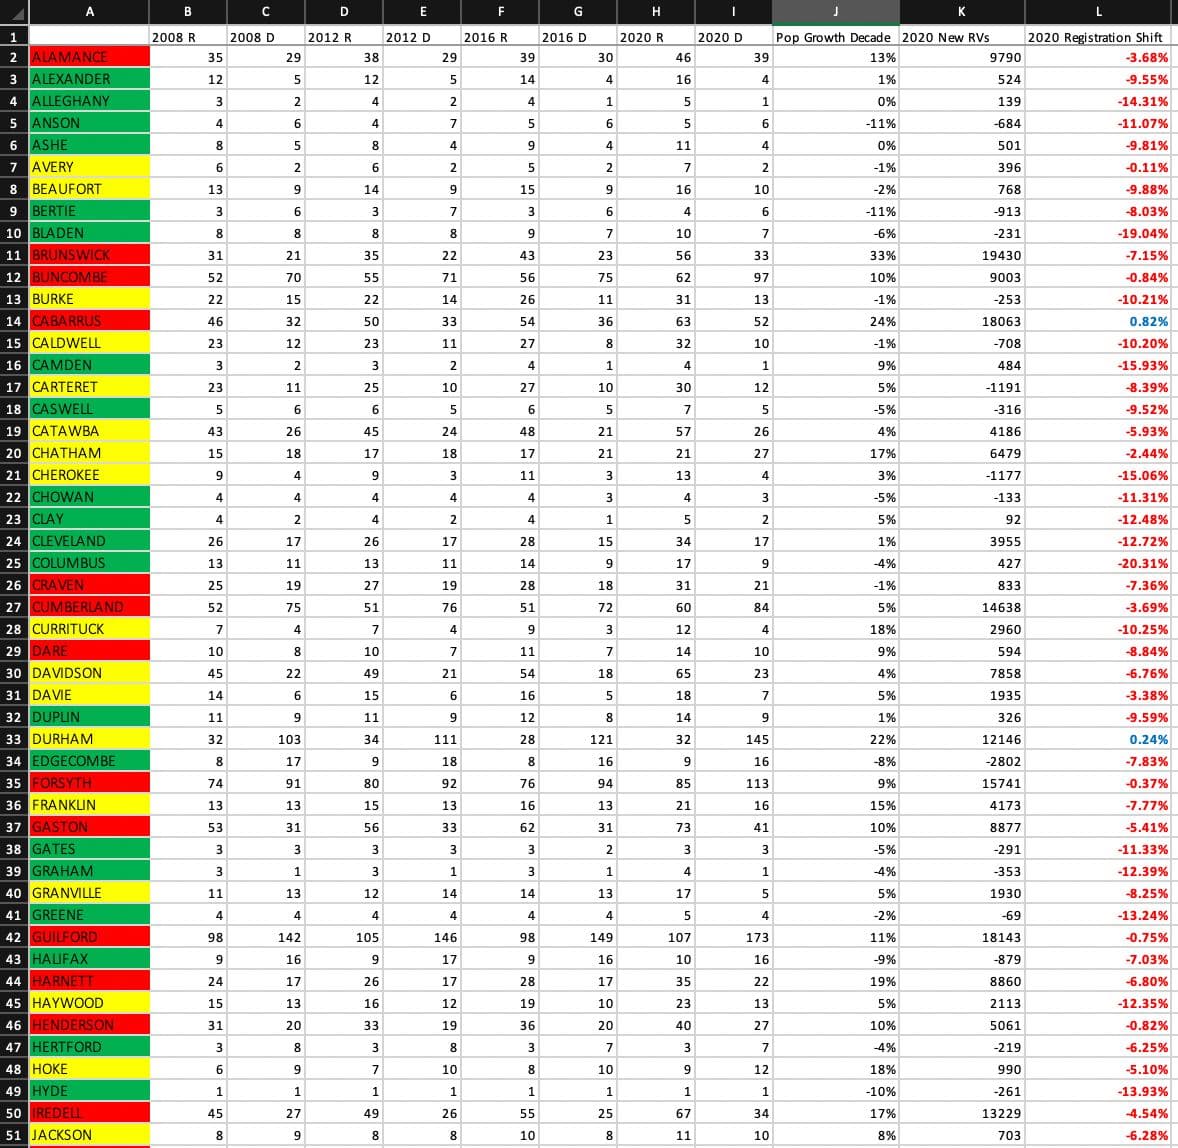
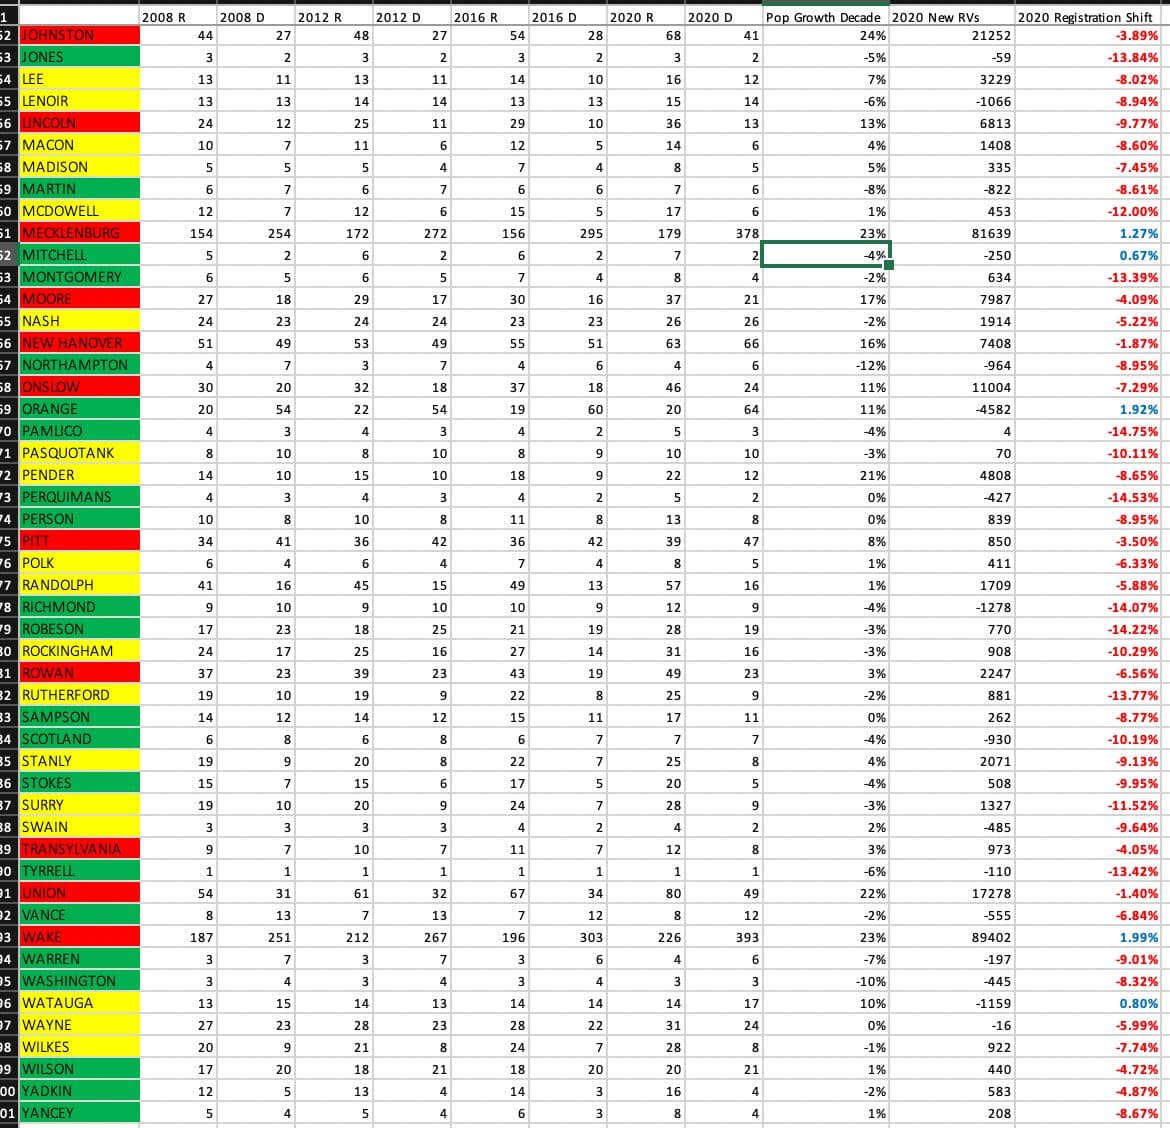
Former US military intelligence officer and statistical analyst Seth Keshel analyzed the trends of voter registrations versus actual votes. The following report indicates which counties’ vote counts align with the trend in voter registrations and which have small or large divergences. Each county is flagged as red, yellow, or green, based on whether the 2020 vote totals aligned with the expected trends (as past decades demonstrate they typically do), or if they diverged in statistically unlikely ways.

| Trump votes | Biden votes | Other votes | |
|---|---|---|---|
| Officially reported results | 2758775 (49.93%) | 2684292 (48.59%) | 81761 (1.48%) |
| Estimate of potential fraud | 257000 (4.7%) | ||
| Estimate of actual result
(with fraud removed) |
2758775 (52.4%) | 2427292 (46.1%) | 81761 (1.6%) |
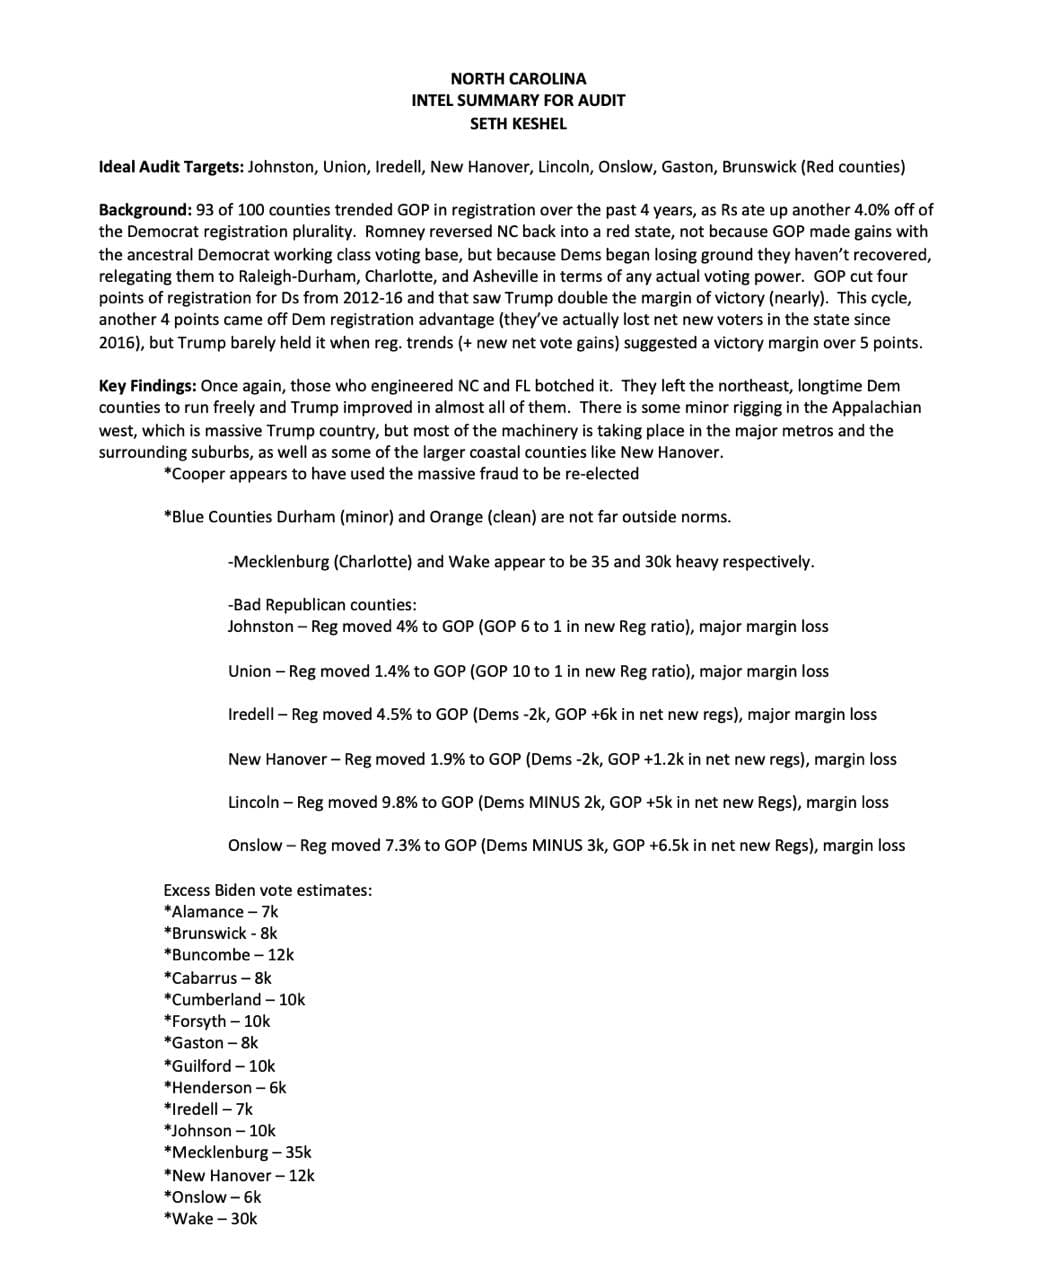
North Carolina drifted another 4% toward Republican registration, but mysteriously, Trump gained a massive 396,000 votes, while Biden gained 495,000 votes, with two previous elections showing 35k (2012) and 11k (2016) vote gains as state moved right.
My estimates suggest minimum of 257k excess Biden votes, slightly more than Roy Cooper’s margin of victory.
If accurate, Trump’s margin in NC would have been 6.3%, or 52.3% to 46.0%, which is in keeping with the registration trend of the past two decades.
Best targets for audits: Johnston, Union, Iredell, New Hanover, Lincoln, Onslow, Brunswick, Gaston
Source: https://t.me/CaptainKMapsandStats/51
Top 100 Worst Counties
Seth has listed North Carolina’s Brunswick, Mecklenburg, New Hanover, and Wake counties as being among the Nation’s Top 100 Worst Counties in terms of abnormal trends during the 2020 election.
Stats By County
Source: https://t.me/CaptainKMapsandStats/51
Brunswick & New Hanover Counties
One on one with Seth Keshel as he answers questions specific to Brunswick County and New Hanover County:
Henderson County
Here’s the attached video:
Following Seth’s post we’ve also done some of our own analysis on Henderson County, NC.
Wake County
The following PDF shows a map of which precincts in the county had the most abnormal results in 2020:
Down Ballot Races
Precinct-Level Data
Seth has produced detailed precinct-level heat maps for several dozen counties in other states but has found it difficult to do so for North and South Carolina:
Possible Voter Roll Manipulation
A number of states, both key competitive states, and not, have machined/trimmed/manipulated their voter rolls for the desired outcomes. See New Hampshire, Alaska, California, and Arizona.
There are other states with bloated rolls, like Florida and Texas. Colorado doesn’t show much movement in the two parties but tons of new registered indies/others, along with Washington and Oregon. Pennsylvania and North Carolina appear to have let their party rolls run clean, showing a tremendous beating getting ready to be done by Trump, but pulled things off differently.
Phantoms.
Source: https://t.me/ElectionHQ2024/788
Events & Presentations
| Date | Presenter | Location | Link |
|---|---|---|---|
| Mon Nov 22, 2021 | Seth Keshel |
Wilmington, North Carolina | More info |
| Sun Nov 21, 2021 | Seth Keshel and Trevor Loudon |
Greensboro, North Carolina | More info |
| Fri Sep 17, 2021 | Seth Keshel and David Clements |
High Point, North Carolina | More info |
| Thu Sep 16, 2021 | Seth Keshel |
Raleigh, North Carolina | More info |
| Wed Sep 15, 2021 | Seth Keshel |
Charlotte, North Carolina | More info |
| Tue Sep 7, 2021 | Seth Keshel, Dr. Douglas Frank, and David Clements |
Cary, North Carolina | More info |
Methodology
Seth Keshel’s estimates are based on the percentage of voters who are registered to each party (where it’s possible to obtain this information) compared to the actual votes for each party. He examined these party trends over the last two decades, as well as population growth, which brought to light the strange and statistically unlikely outliers and anomalies that occurred in 2020. We explain this process, step by step, with visual examples, in our guide How to Predict Election Results Using Registration Data, so that you can investigate the numbers for yourself.
This video from Telegram also explains some of Seth’s approach to analyzing precincts.
Raw Data
We aim to publish links to both the raw election data and voter registration data for North Carolina so that citizens and researchers can analyze this information for themselves.
Election Audit Groups on Telegram
Further updates from Seth Keshel can be found on his Telegram Channel @ElectionHQ2024.
To join the grassroots efforts in pursuing election integrity and audits of the 2020 election in North Carolina, you can join the following groups on Telegram:
- NC Elections
- North Carolina Audit Force
- North Carolina Audit Force Discussion
- North Carolina One Six (helping Jan 6 political prisoners)
- North Carolina One Six Discussion (helping Jan 6 political prisoners)
- Transparent Elections NC
For other states, see our Full List of Telegram Channels.
ElectionFraud20.org and Seth Keshel have no affiliation with nor any responsibility for these channels. Discern carefully, as some users and even admins of channels have shown obstruction to transparent audits of our elections.