See also the main article on Pennsylvania, for documented election integrity issues and further reports.
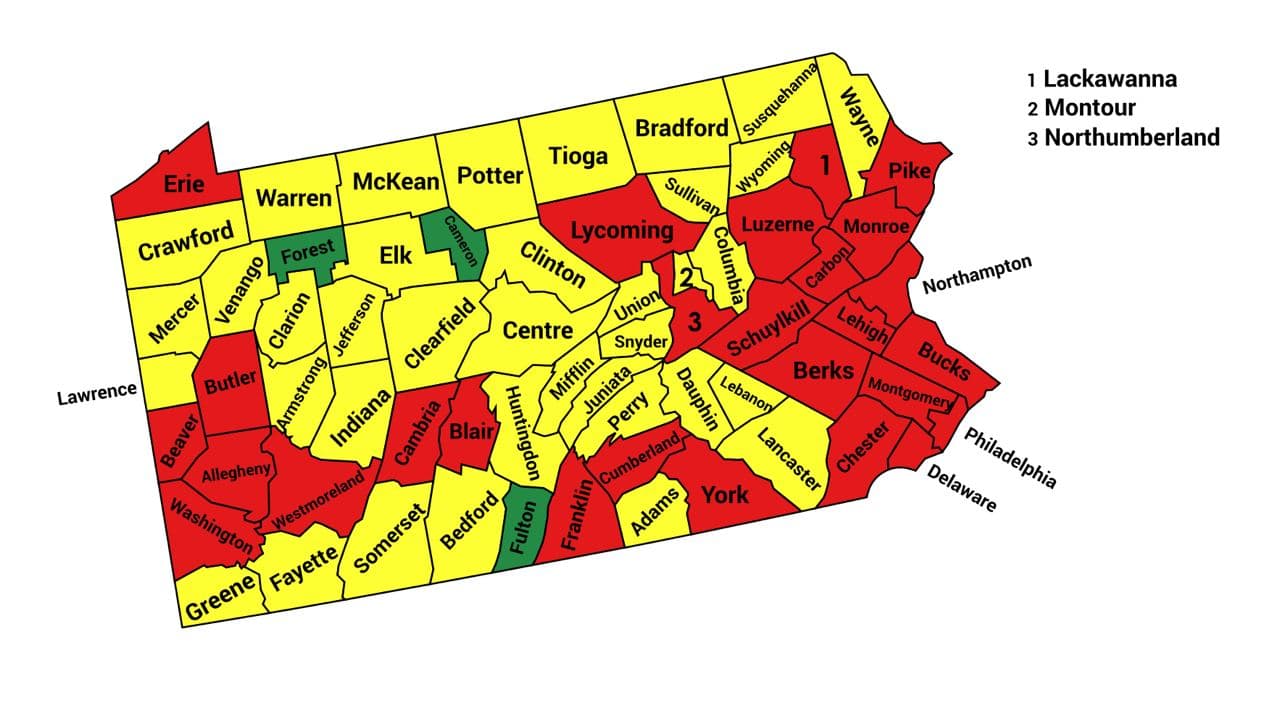
Former US military intelligence officer and statistical analyst Seth Keshel analyzed the trends of voter registrations versus actual votes. The following report indicates which counties’ vote counts align with the trend in voter registrations and which have small or large divergences. Each county is flagged as red, yellow, or green, based on whether the 2020 vote totals aligned with the expected trends (as past decades demonstrate they typically do), or if they diverged in statistically unlikely ways.

| Trump votes | Biden votes | Other votes | |
|---|---|---|---|
| Officially reported results | 3378263 (48.8%) | 3459923 (50.0%) | 83038 (1.2%) |
| Estimate of potential fraud | 504000 (7.3%) | ||
| Estimate of actual result
(with fraud removed) |
3378263 (52.6%) | 2955923 (46.1%) | 83038 (1.3%) |
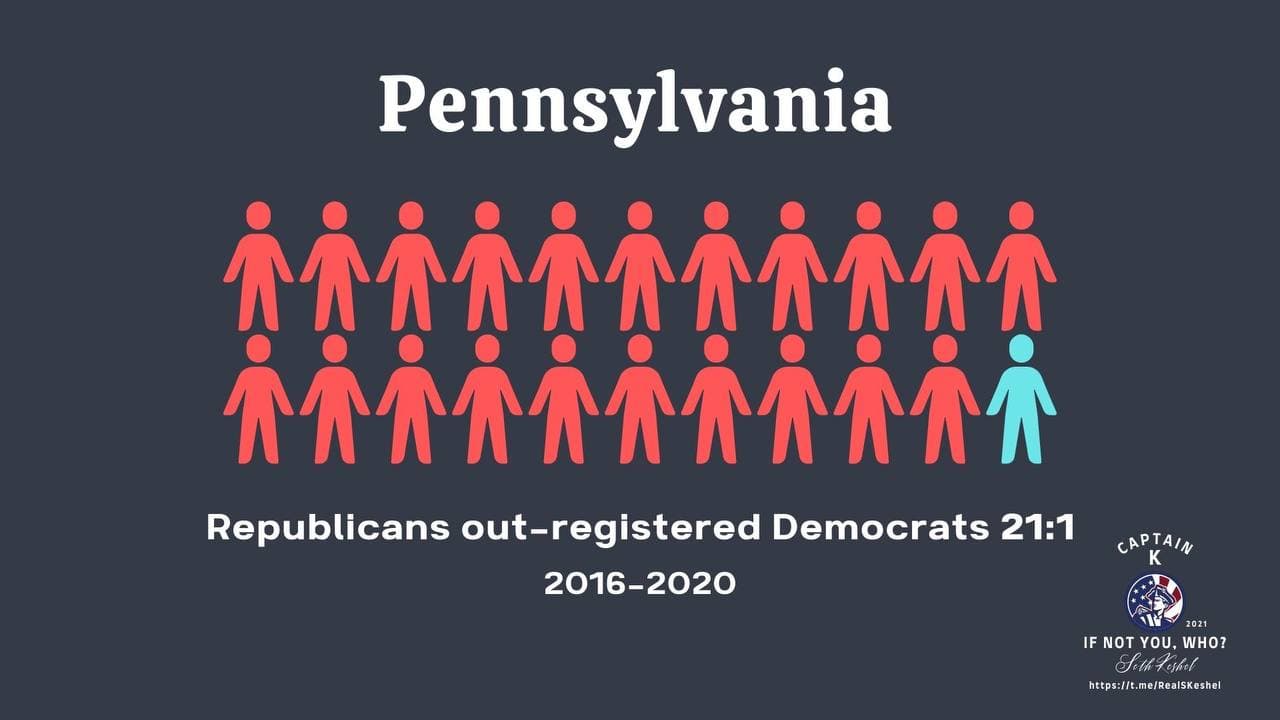
Even worse than I thought. PA was a slam dunk for Trump, with a 244k-12k (21 to 1 ratio) of net new registrations in previous 4 years that previously predicted Trump flip in 2016.
This is horrific. Only 3 counties I see as relatively clean, with 27 classified as major. 60 of 67 counties should have been more GOP than last time per registration trends, but only 20 trended more GOP. This flipped Erie and Northampton, which should have been slam dunks.
Trump crushed Obama ’08 total in a shrinking state, only to be passed on strength of what I assess to be 504k excess votes!
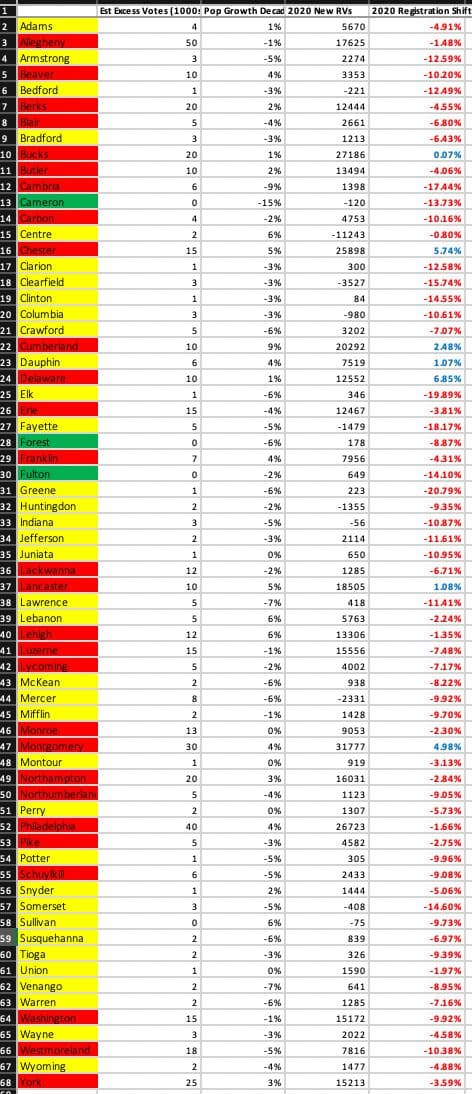
The worst counties:
| Allegheny | 50k | |
| Berks | 20k | see further analysis below |
| Bucks | 20k | |
| Chester | 15k | |
| Erie | 15k | see further analysis below |
| Lackawanna | 12k | |
| Lehigh | 12k | |
| Luzerne | 15k | |
| Montgomery | 30k | |
| Northampton | 20k | |
| Philadelphia | 40k | |
| Washington | 15k | |
| Westmoreland | 18k | see further analysis below |
| York | 25k |
Trump margin, if accurate, should have been 52.0% to 46.1% (5.9%), or 424k votes. A bludgeoning in keeping with registration trend.
Source: https://t.me/CaptainKMapsandStats/73
Top 100 Worst Counties
Seth has listed Pennsylvania’s Allegheny, Berks, Bucks, Chester, Delaware, Erie, Lackawanna, Luzerne, Montgomery, Northampton, Philadelphia, Westmoreland, and York counties as being among the Nation’s Top 100 Worst Counties in terms of abnormal trends during the 2020 election.
Videos Covering Pennsylvania
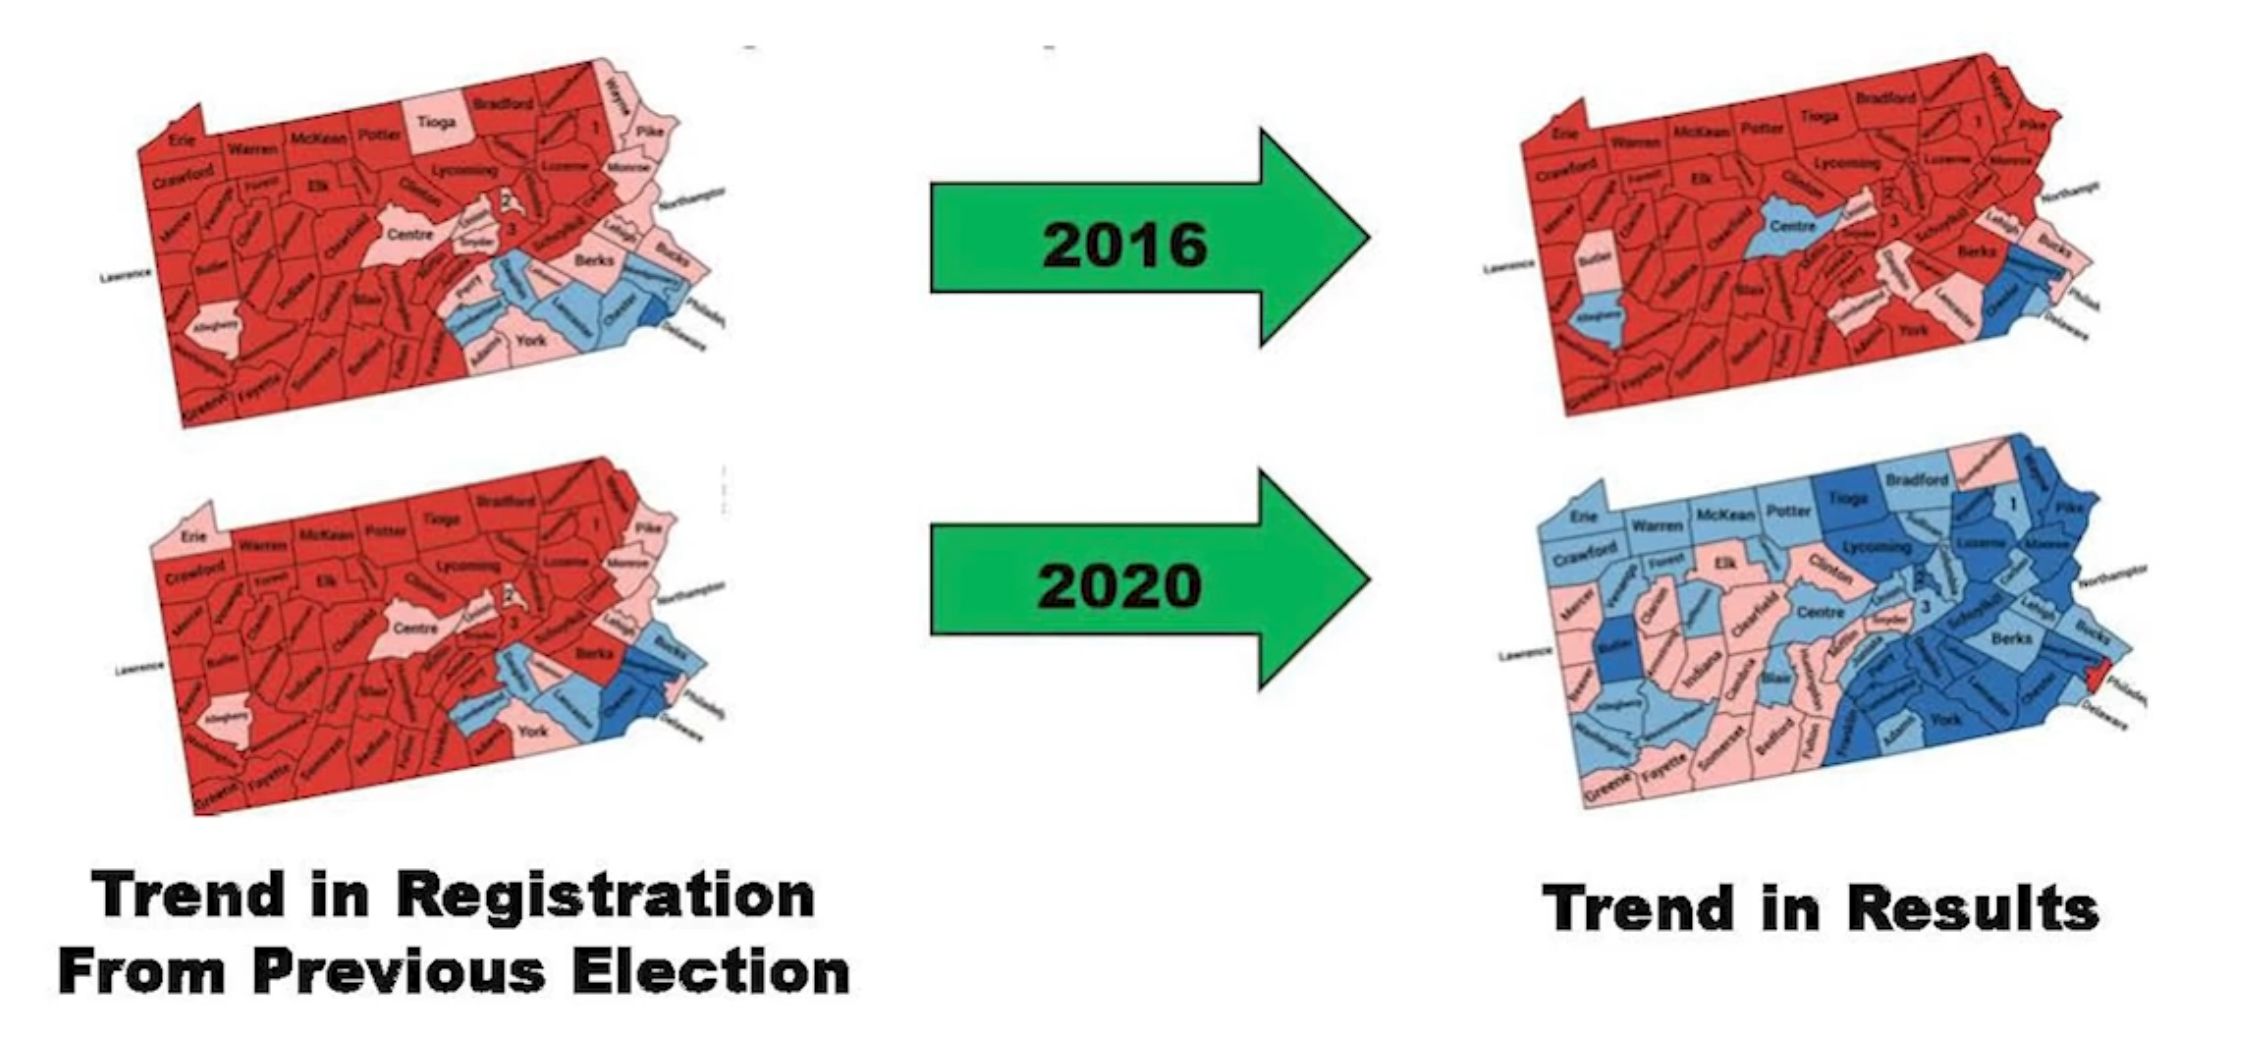
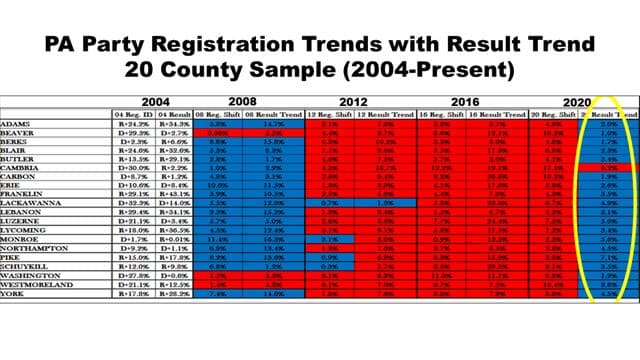
The Trends Visualized
The following slide shows how in 2016 (and in many elections prior), the trend in voter registrations (towards Republican) also paralleled the trend in election results; however in 2020, although the state had many more Republicans registering to vote, the final results trend in the opposite direction:
Stats By County
November 2020 Presentation
Seth Keshel gave the following presentation to the Pennsylvania Republican Party on 11 Nov 2020:
Followed by this official, signed declaration of the results he discovered:
He later expanded upon and revised his initial analysis, as per the sections below.
Bellwether Counties in Pennsylvania
This is from the scrap heap, and is complicated, but if you want some of my Pre-election work to chew on, here is some good stuff.
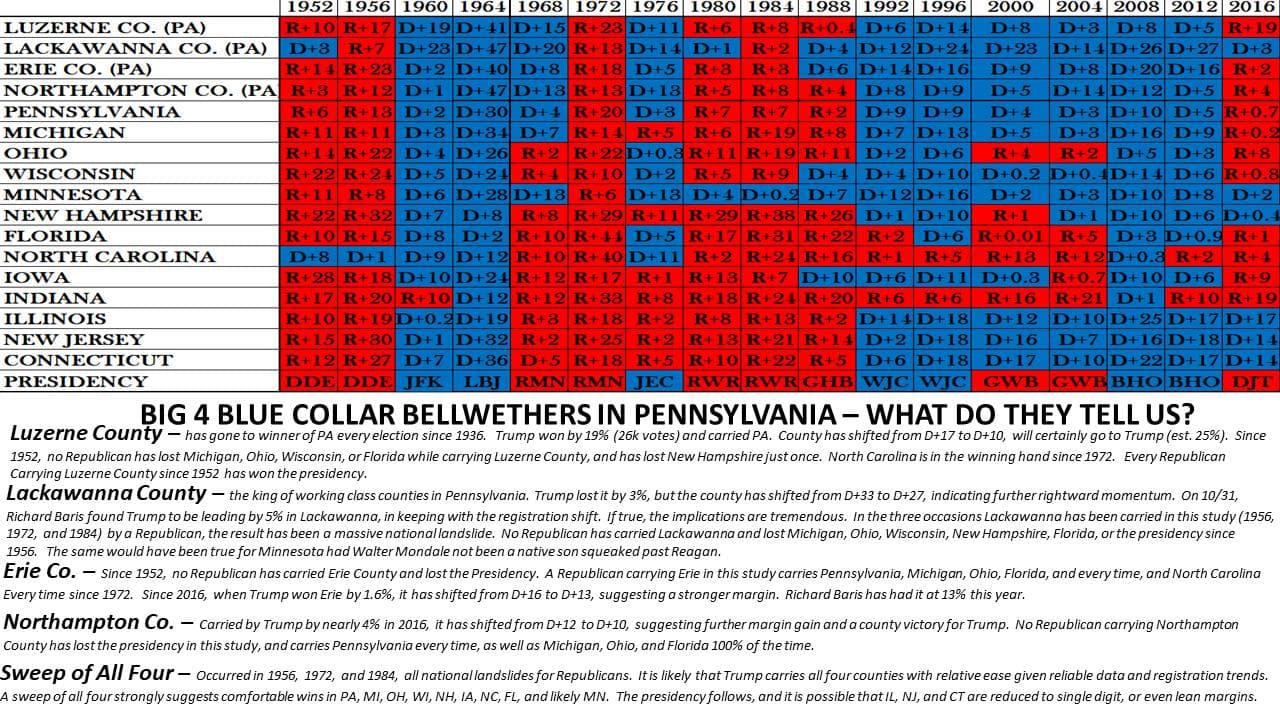
Luzerne, Erie, Northampton were three Trump flips that moved a lot in GOP registration. Two were stolen back to blue. GOP control of those three shows strong working class support and a win in MI.
Lackawanna is another story, similar to Mahoning in Ohio (won by Trump), lost by 3% in 2016 and trended hard R (Baris had Trump up 6 there) suggesting a flip this year, Scranton Joe effect be damned.
A GOP win there resonates all the way to Minnesota in terms of working class depth.
The slide reads itself in the bottom but keep in mind, DJT working class support tightens a lot of states not thought of looking back at history.
Source: https://t.me/ElectionHQ2024/651
Berks County
County Commissioner Leinbach of Berks County says this was a great election. Best in history, maybe ever.
Here, Seth shows you the 20,000 extra Biden votes in that county. Make sure you know the difference between phony, surface-skimming audits and real ones that identify phantom voters.
Source: Telegram Post, Aug 31, 2021
Butler County
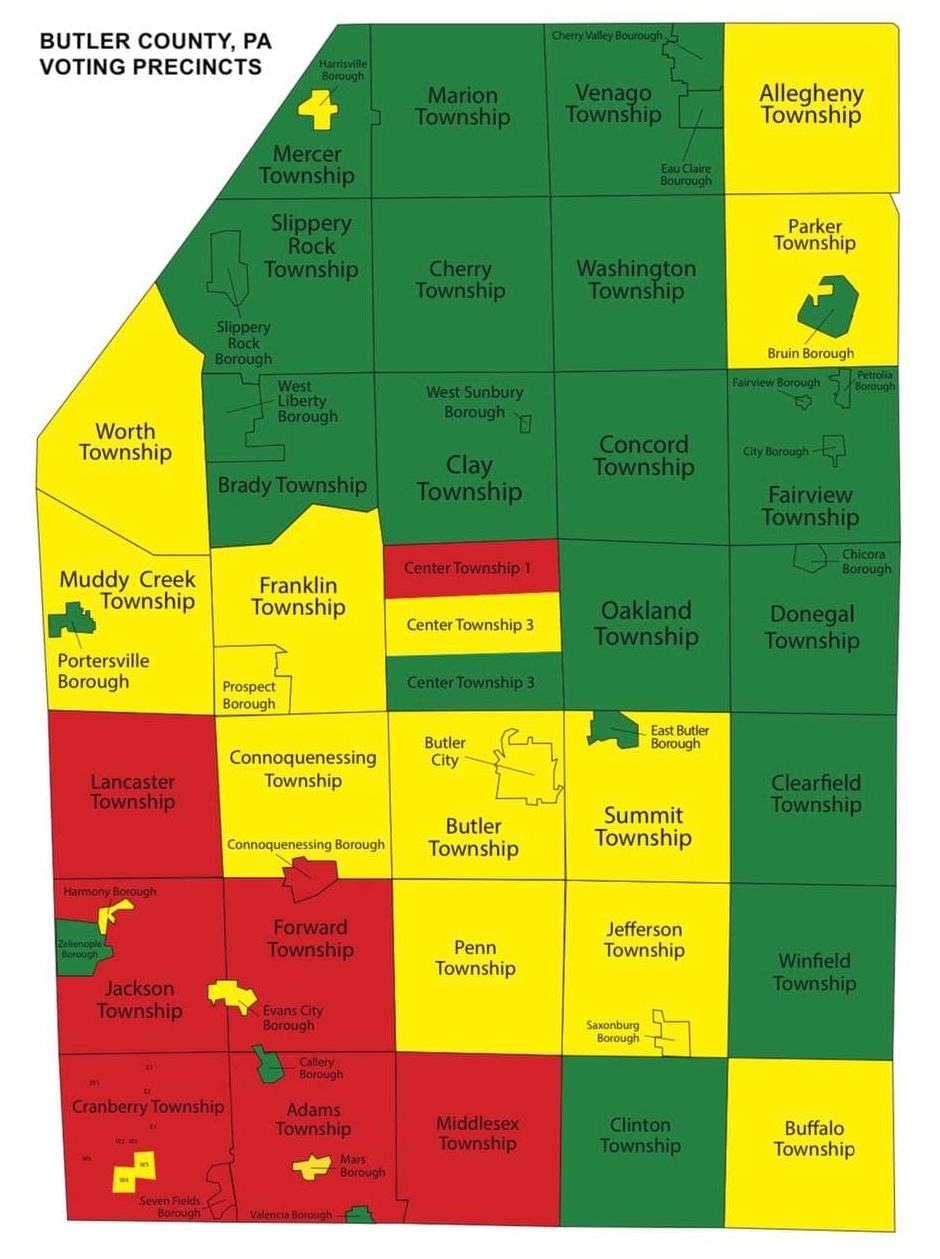
Seth provides some further stats and analysis on Butler County in the following video:
Source: Telegram Post, Oct 23, 2021
Thanks to Butler County (PA) Patriots, the following post shows county officials communicating before and after election about various issues, mostly related to their elections equipment (machines and scanners), pondering why votes are being subtracted and totals erroneous.
Also admitting issues with the voter list, even though we are told this is the most secure election in history. Also here, a results page showing DJT with over 80% of in person vote for him, but losing mail in vote nearly 2 to 1.
Delaware County
Erie County
We’ve also analyzed some additional stats for Erie County, being discussed in our Gitlab discussion area:
Philadelphia County
Westmoreland County
Source: Telegram Post, Aug 25, 2021
Possible Voter Roll Manipulation
A number of states, both key competitive states, and not, have machined/trimmed/manipulated their voter rolls for the desired outcomes. See New Hampshire, Alaska, California, and Arizona.
There are other states with bloated rolls, like Florida and Texas. Colorado doesn’t show much movement in the two parties but tons of new registered indies/others, along with Washington and Oregon. Pennsylvania and North Carolina appear to have let their party rolls run clean, showing a tremendous beating getting ready to be done by Trump, but pulled things off differently.
Phantoms.
Source: https://t.me/ElectionHQ2024/788
Seth also reports that, strangely, 25.7% of registered voters in York County are recorded as registering on January 1. Either this is lazy record-keeping, or a possible indication of manipulation of voter rolls.
Source: https://t.me/ElectionHQ2024/814
Pennsylvania Voter Roll Analysis
Here is the promised voter registration rolls with analysis on five counties holding an estimated 92,000 extra Biden votes (enough to flip the state!):
Erie, Luzerne, Franklin, Montgomery, York
Further Updates on Pennsylvania
So What Should We Do?
For those who asked “what do we do?” in PA in response to those five counties I posted the registration problems with:
-
Put the heat on the entire state Republican party, specifically Corman, Benninghoff, Cutler, and Grove, the worst of the RINO coalition there.
-
Ask Lawrence Tabas (PA GOP chair) to get busy demanding answers. These issues with the registration info demand answers, even if the info posted yesterday matches real voters to some degree (I’m saying I’m confident it’s not all malfeasance).
-
Support Senator Mastriano. Call his office and thank him for his stand.
-
Melt down the phone lines of the county commissioners in those five counties. You have the information now. Put them on the spot to defend their filthy voter rolls. This is particularly useful for counties insisting they had great elections, like York did recently when they rebuffed an audit.
Source: https://t.me/ElectionHQ2024/836
Events & Presentations
| Date | Presenter | Location | Link |
|---|---|---|---|
| Sat Mar 19, 2022 | Seth Keshel |
Gettysburg, Pennsylvania | More info |
| Fri Mar 18, 2022 | Seth Keshel and Dr Doug Frank |
Leesport, Berks County, Pennsylvania | More info |
| Wed Oct 27, 2021 | Seth Keshel and Dr. Douglas Frank |
Butler County, Pennsylvania | More info |
| Thu Oct 14, 2021 | Seth Keshel |
Manheim, Lancaster County, Pennsylvania | More info |
| Wed Oct 13, 2021 | Seth Keshel and Senator Doug Mastriano |
Chesco Town Hall, Chester County, Pennsylvania | More info |
Methodology
Seth Keshel’s estimates are based on the percentage of voters who are registered to each party (where it’s possible to obtain this information) compared to the actual votes for each party. He examined these party trends over the last two decades, as well as population growth, which brought to light the strange and statistically unlikely outliers and anomalies that occurred in 2020. We explain this process, step by step, with visual examples, in our guide How to Predict Election Results Using Registration Data, so that you can investigate the numbers for yourself.
This video from Telegram also explains some of Seth’s approach to analyzing precincts.
Raw Data
We aim to publish links to both the raw election data and voter registration data for Pennsylvania so that citizens and researchers can analyze this information for themselves.
Other Reports
-
A team of scientists from Election-Integrity.info produced the report “2020 Presidential Election Startling Vote Spikes” which includes a section on Pennsylvania
-
AuditTheVotePA.com has further information, data, petitions and interviews
-
See also the main Pennsylvania article for more
Election Audit Groups on Telegram
Further updates from Seth Keshel can be found on his Telegram Channel @ElectionHQ2024.
To join the grassroots efforts in pursuing election integrity and audits of the 2020 election in Pennsylvania, you can join the following groups on Telegram:
For other states, see our Full List of Telegram Channels.
ElectionFraud20.org and Seth Keshel have no affiliation with nor any responsibility for these channels. Discern carefully, as some users and even admins of channels have shown obstruction to transparent audits of our elections.