Thanks to UnderstandingEdison.us for providing this educational article — designed to help people learn, communicate and understand the only publicly-available time-series election count data. To download the NYT data, see here.
Final, certified election counts for each state are usually available from each state’s Secretary of State. But if you want to get the batch-by-batch counts, as the ballots came in on election night, the only place (we’ve found) to get that is from the New York Times JSON data files that run behind its website.
Here is a typical picture from election night.

That’s what CNN show. They most-likely arranged a direct feed from Edison Research, costing thousands of dollars. We don’t get that, unfortunately.
Here is the data that the NYT gives us:
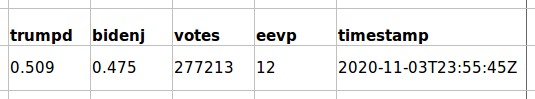
You’ll see a row like this for every batch that came in for a particular state (nope, no time-series precinct or county data unfortunately).
It is vitally important to realize these 5 columns are the only time-series data we have from the election night!
All we have are the ratio of votes that each of the candidates have, the total number of accumulated votes so far, the estimated percentage of votes counted so far (eevp) and the time stamp of the update.
Unfortunately the specific number of votes for each candidate at that time is not provided. Only occasionally can we glimpse it on TV or the news.
The ratios for each candidate are only given to 3 decimal places so this restricts the data even more.
Most analysis is made by only looking at two of these columns: the ratios and the total accumulated votes.
Since the actual number of votes is not provided, the temptation is to reverse engineer them and this is where rounding errors happen.
The ratio of the votes that each candidate has is only shown to three decimal places. Calculations can be imprecise because of this. Spurious digits are introduced by calculations carried out to lesser precision than that of the original data leading to wrong or misleading results.
Example 1:
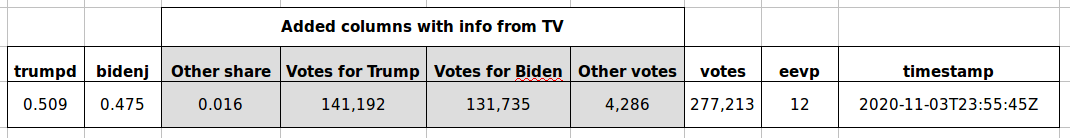
Even though Trump’s actual ratio is:
141,192 / 277,213 = 0.509326763174887
and Biden’s is
131,735 / 277,213 = 0.475212201447984
only the first three digits are given in the data.
If someone tries to calculate the precise Trump or Biden vote count from the NYT data, the vote count will be wrong.
Example 2:
Trump: 0.509 * 277,213 = 141101.417 [correct value is 141,192]
Biden: 0.475 * 277,213 = 131676.175 [correct value is 131,735]
The amount by which these vote counts are wrong varies over time. In some instances, when comparing two consecutive wrong vote counts, the later vote count will be a lower number and votes will seem to be have been taken away from a candidate.
Also many are lead astray when they wrongly see what looks like a fractional vote count (e.g. 141101.417).
In reality, nothing more than a comparison of imprecise vote counts is occurring.
Common Errors
Here is a spread sheet showing a couple of mistakes that we see several people making.
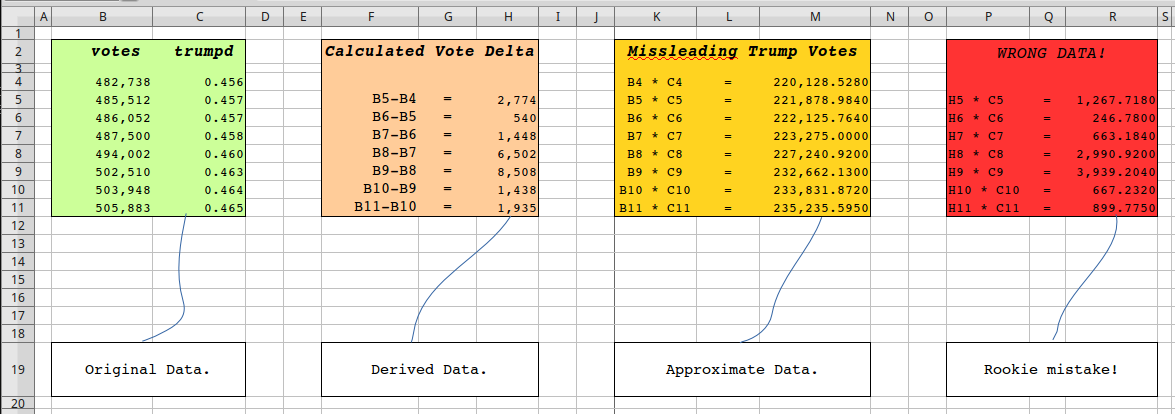
Column B and C show the data we get from the New York Times web site.
The accumulative total votes and the proportion (to three decimal places only) of those that Trump has.
Everyone is happy the news desk can look at the latest data (B11 and C11) at the end of this block and announce that 505,883 votes have been counted and Trump has 46.5% of them.
But we are not happy with that and want to know more! One thing we can do is to calculate the amount of votes that have been counted at each step; as seen in column H. (Problems abound even with this number but I will save that analysis for another time.)
Then, not satisfied with a ratio we might try to calculate the number of votes Trump has by multiplying the numbers in column B by the numbers in column C. We then run straight into rounding errors. As we now know this is NOT split voting, just an imprecise calculation!
Finally in the last block we have a totally erroneous calculation. The gap between one total and the next (essentially a random number) is taken and multiplied by the ratio of votes that Trump has?! This is like multiplying apples by pears and thinking the answer is plums! At best this shows a total misunderstanding of the data as shown here on the home page.
There are a lot of bad actors raising a smoke screen on the internet. We want to see genuine election fraud come to light, and not get distracted by miscalculations.
Share this with anyone you think might benefit.