See also the main article on New Hampshire, for documented election integrity issues and further reports.
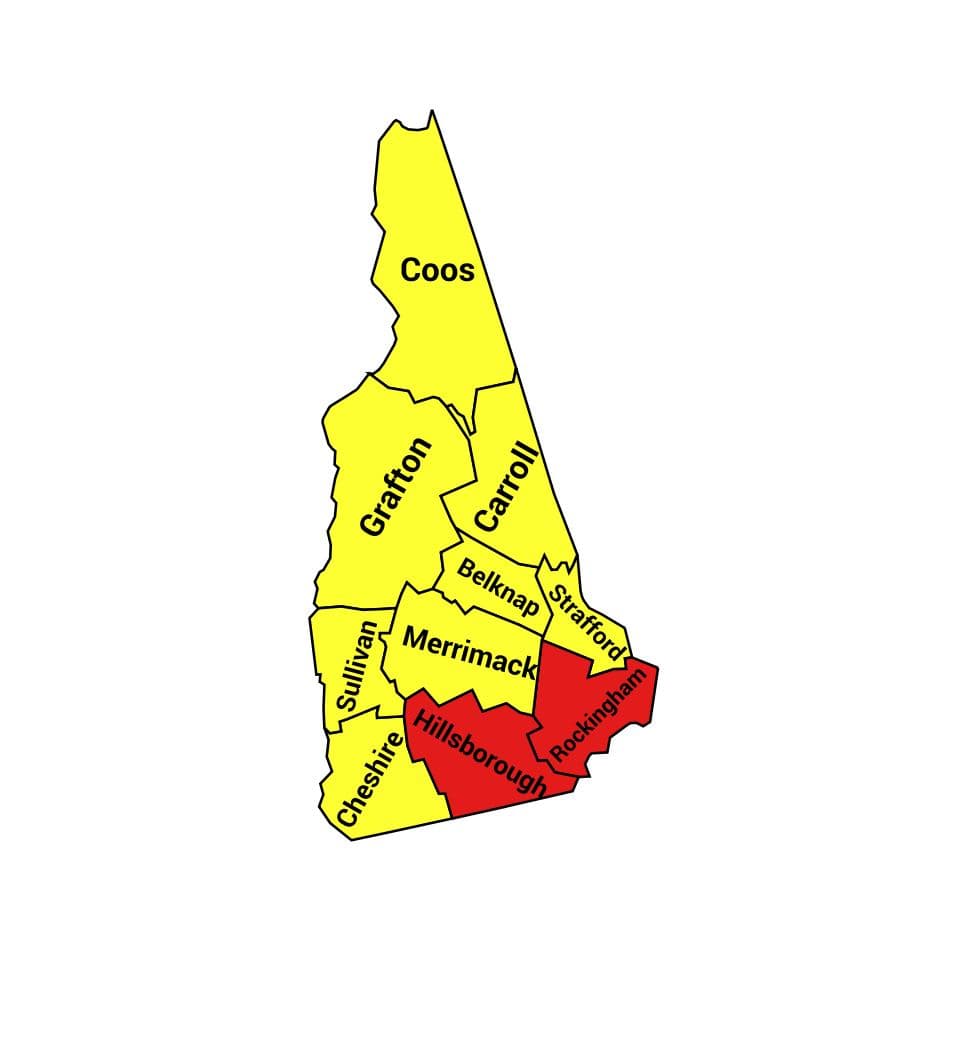
Former US military intelligence officer and statistical analyst Seth Keshel analyzed the trends of voter registrations versus actual votes. The following report indicates which counties’ vote counts align with the trend in voter registrations and which have small or large divergences. Each county is flagged as red, yellow, or green, based on whether the 2020 vote totals aligned with the expected trends (as past decades demonstrate they typically do), or if they diverged in statistically unlikely ways.

| Trump votes | Biden votes | Other votes | |
|---|---|---|---|
| Officially reported results | 365654 (45.36%) | 424921 (52.71%) | 15559 (1.93%) |
| Estimate of potential fraud | 40000 (5.0%) | ||
| Estimate of actual result
(with fraud removed) |
365654 (47.7%) | 384921 (50.2%) | 15559 (2.0%) |
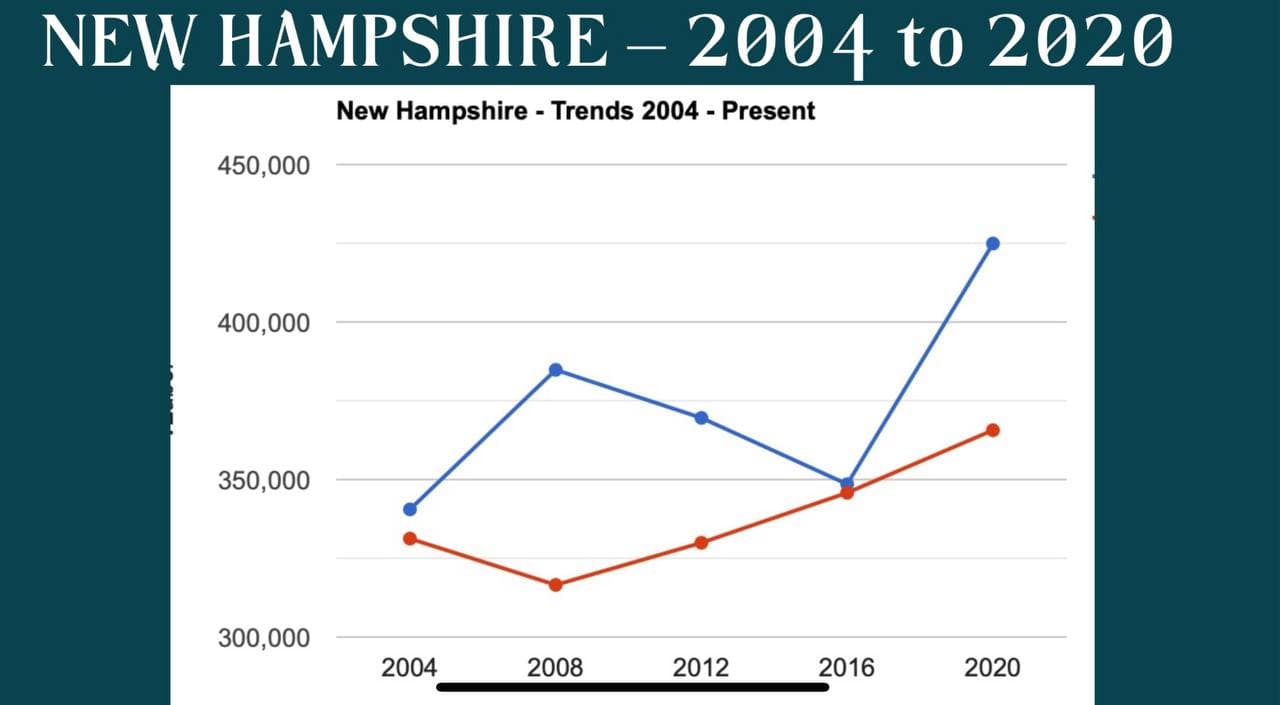
New Hampshire was almost won by Trump in 2016, with just under 3,000 vote difference. Trump’s anti-war stance made him a perfect fit to flip New Hampshire, as the Iraq War is a key reason Bush lost it in 2004 after carrying it in 2000. Working class shift in effect as seen in the Midwestern states, Democrat peak being in 2008, with a heavy share of independent voters.
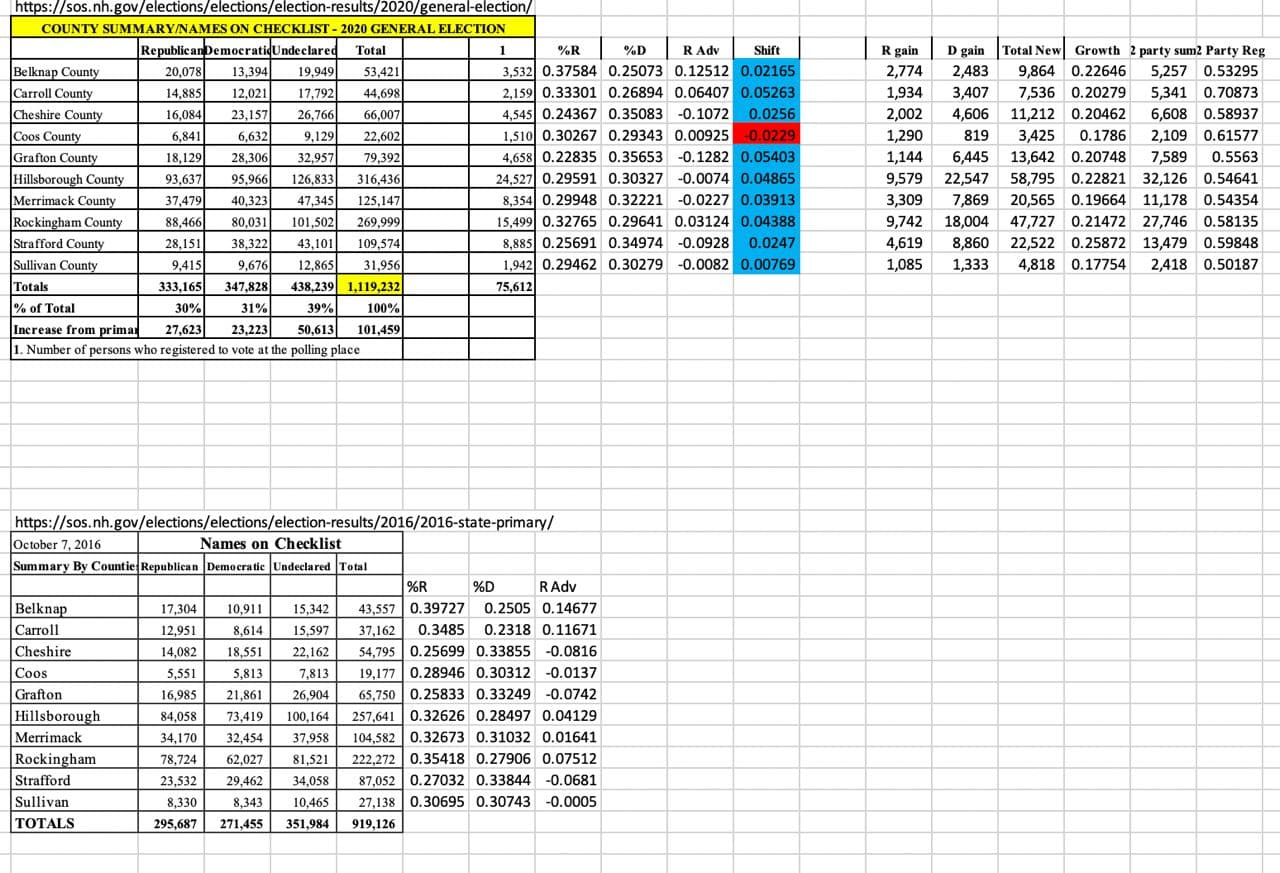
The trends in voter registrations indicate that Biden has 40,000 more votes than what seems reasonable. Rockingham (14k) and Hillsborough (12k) are the most glaring culprits. The issue appears to lie in registrations. The trend is similar to other stagnant population states:
- Better for Republican in 2012
- Flip/near flip in 2016
- Republican vote gain in 2020
But Biden’s gain is nearly 80k in a tiny state. 200k new registrations since 2016, after just 13k new from 2012-2016 seems questionable.
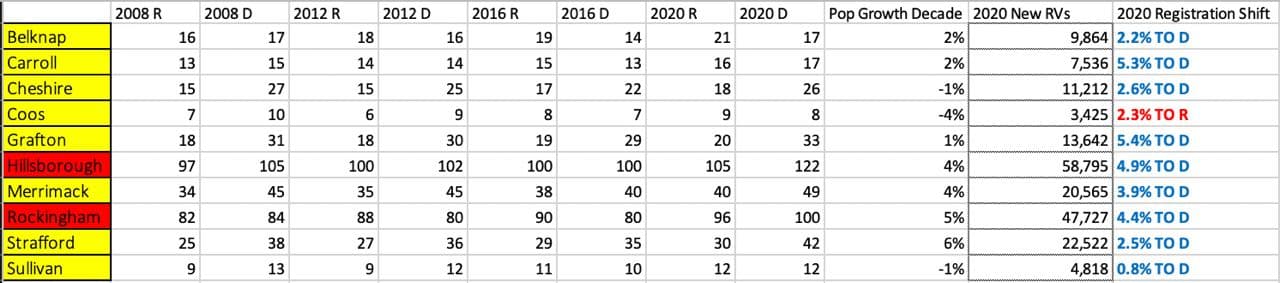
As state trended more Republican from 2008:
| 2012 | -7k Republican registrations, -32k Democrat registrations, leaving the state 4.1% more Republican in the vote |
| 2016 | +23k Republican registrations, +21k Democrat registrations, leaving the state 5.2% more Republican in the vote |
| 2020 | A big Democrat surge to push the margin to 7.35% for Biden (as certified) would normally require a drop in the Republican rolls as seen in 2004-2008; but instead, Republicans gained 37k (14k more than 2016), only to be smashed by 77k new Democrat registrations and 51k new “undeclared” independent voters |
Incredible how Biden reversed two cycles of Democrat decline amidst a Trump favoring coalition shift in NH to post a gain nearly 2x larger than Obama’s in 2008.
Registration numbers alone suggest the state would drift left, but based on the above, the method of registering voters appears far different from previous years. The 15-fold increase in new registered voters since 2016 needs investigating.
If we remove the 40,000 excess votes, Biden’s lead would dwindle to 50.2% to 47.7% (2.5% lead), or just 19k votes. If there is additional fraud via votes being flipped electronically, then this state should have been a win for Trump. I had it two or less to either candidate (tilt) leading up to the election.
Best targets for audits: Hillsborough, Rockingham, Merrimack, Strafford
Here is a breakdown of individual counties:
Source: https://t.me/CaptainKMapsandStats/86
Top 100 Worst Counties
Seth has listed New Hampshire’s Rockingham County as being among the Nation’s Top 100 Worst Counties in terms of abnormal trends during the 2020 election.
Possible Voter Roll Manipulation
A number of states, both key competitive states, and not, have machined/trimmed/manipulated their voter rolls for the desired outcomes. For example, in New Hampshire:
From 2008-16, the state only added 13,000 net new registered voters. Yet in the past four years, they added 200,000, pushing the state a couple points to the left. This would make an analyst looking at party registration shifts assume “New Hampshire moves left.”
Republicans registered 37k, but were out-registered 2:1 by Democrats overall, with another 97k Independent/Other. So, 200,000 new registered voters in a state of 1.37 million. For perspective, neighboring Vermont, with close to half of the population of New Hampshire, registered just 34k net new voters (also probably heavy based on county analysis) – meaning NH is 3x higher in net new registered voters if we set populations to equal.
These look a lot like phantom voters – fake records added to the rolls – and need investigating.
Source: https://t.me/ElectionHQ2024/788
Seth’s Presentation in New Hampshire
Nov 19, 2021
Events & Presentations
| Date | Presenter | Location | Link |
|---|---|---|---|
| Fri Nov 19, 2021 | Seth Keshel and David Clements |
Manchester, New Hampshire |
Further Updates
Methodology
Seth Keshel’s estimates are based on the percentage of voters who are registered to each party (where it’s possible to obtain this information) compared to the actual votes for each party. He examined these party trends over the last two decades, as well as population growth, which brought to light the strange and statistically unlikely outliers and anomalies that occurred in 2020. We explain this process, step by step, with visual examples, in our guide How to Predict Election Results Using Registration Data, so that you can investigate the numbers for yourself.
This video from Telegram also explains some of Seth’s approach to analyzing precincts.
Raw Data
We aim to publish links to both the raw election data and voter registration data for New Hampshire so that citizens and researchers can analyze this information for themselves.
Other News
-
Windham County previously held an audit, but there are claims that the audit was influenced by auditors with close-ties to the Democratic party. See article by The Gateway Pundit.
-
Mark Alliegro, New Hampshire State Representative, spoke at the Cyber Symposium (view video, starting around 2hr 55min mark) saying:
- New Hampshire was one of the first states to take action against Colonialism. First state to form government and have independent constitution.
- He didn’t need convincing of a stolen election. On election night, it was very obvious that it was stolen. He wanted to go home with an action plan.
- What happened in Windham? It was an attempt to steal Windham, but a cheat-proof majority was built.
- An audit was accomplished, but it went out of their control and into the hands of the wrong people. You must make sure you control every aspect of the audit! You must get the keys to every locked room.
- “We’re going to win”
-
“The day the yoke of Rome falls, will be the day of a great rejoicing!”
-
Another attendee at Mike Lindell’s Cyber Symposium shares that LHS Associates manages and supports the election technology across the states in New England. After the election, the memory cards were mailed back to LHS and data was not preserved, breaking federal law. Workers did manage to save 4 cards in Windham during an audit, but then they were also later wiped. The staff simply replied: “Oops, they were wiped already!” No enforcement of these crucial laws is happening to date. They said that this needs to be rectified, and some people need to be prosecuted.
-
Also shared at the Symposium: apparently a movie is coming out with 300 clips of issues with the “sham audit” in New Hampshire. Look out for this.
-
Dallas, Texas 2020 Election Fingerprints, is a report on election votes vs turnout patterns (or “fingerprints”) by wwrkds.
Election Audit Groups on Telegram
Further updates from Seth Keshel can be found on his Telegram Channel @ElectionHQ2024.
To join the grassroots efforts in pursuing election integrity and audits of the 2020 election in New Hampshire, you can join the following groups on Telegram:
- Marylyn Todd, NH Voter Integrity Group
- New Hampshire Audit Force
- New Hampshire Audit Force Discussion
- New Hampshire Audit
- New Hampshire One Six (helping Jan 6 political prisoners)
- New Hampshire One Six Discussion (helping Jan 6 political prisoners)
- NH Audit Chat
- NHAuditChat
- NH Voter Integrity Group
- NH Voter Integrity Group (Website)
For other states, see our Full List of Telegram Channels.
ElectionFraud20.org and Seth Keshel have no affiliation with nor any responsibility for these channels. Discern carefully, as some users and even admins of channels have shown obstruction to transparent audits of our elections.