See also the main article on California, for documented election integrity issues and further reports.
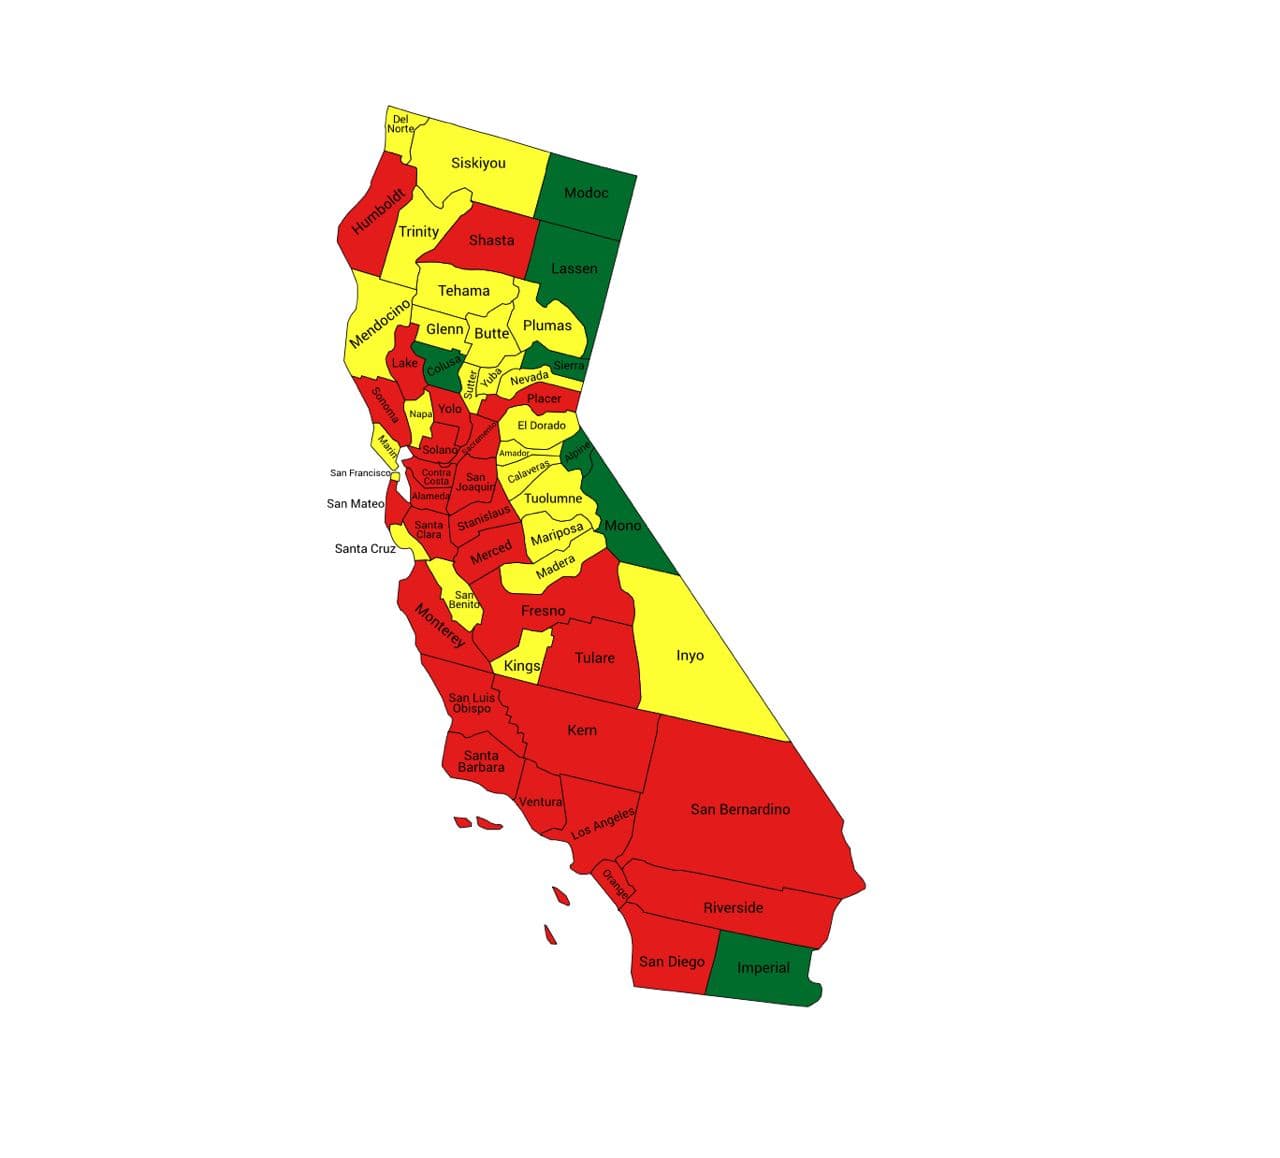
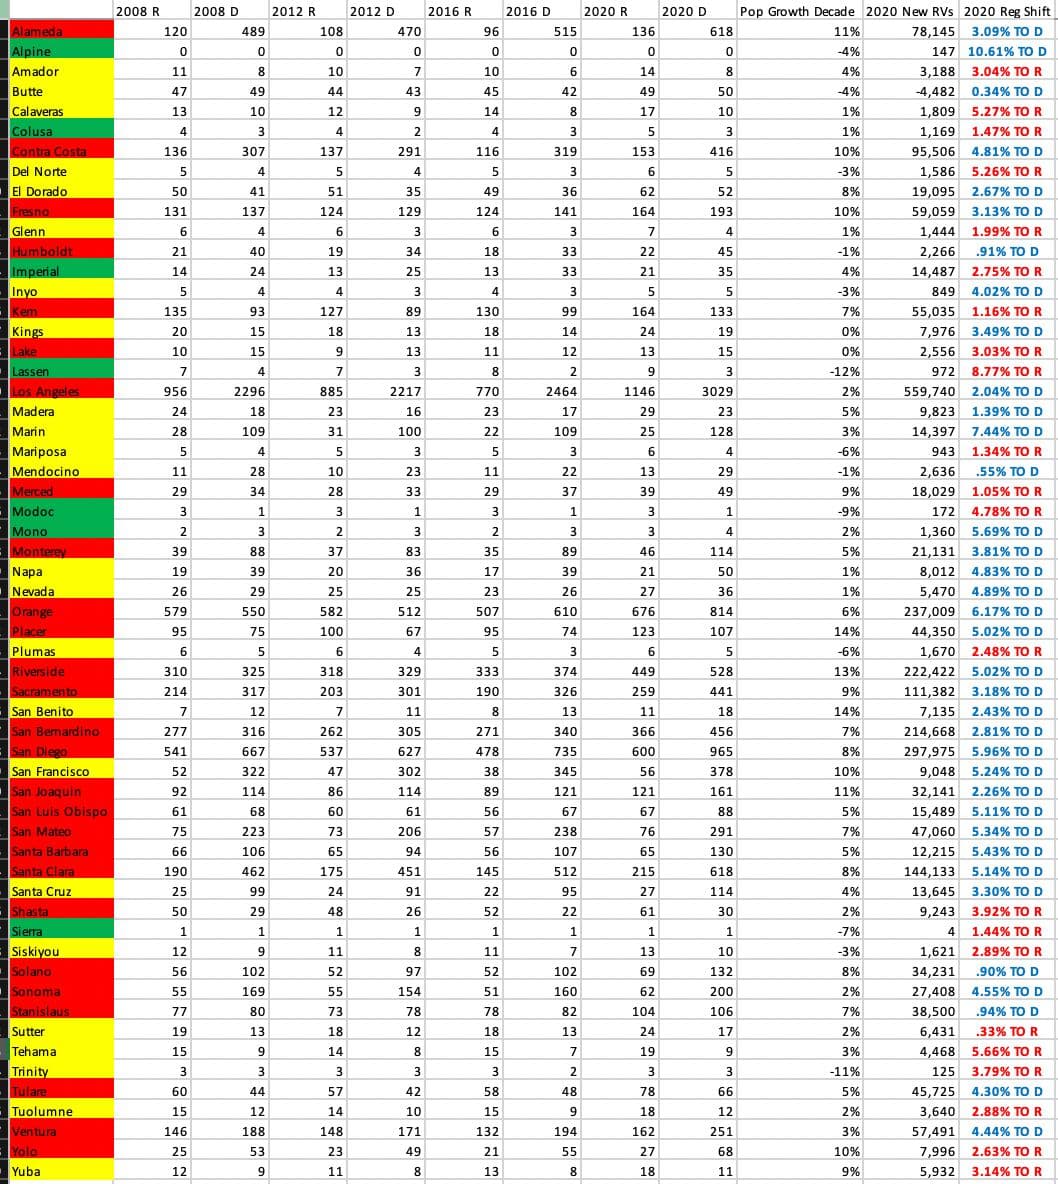
Former US military intelligence officer and statistical analyst Seth Keshel analyzed the trends of voter registrations versus actual votes. The following report indicates which counties’ vote counts align with the trend in voter registrations and which have small or large divergences. Each county is flagged as red, yellow, or green, based on whether the 2020 vote totals aligned with the expected trends (as past decades demonstrate they typically do), or if they diverged in statistically unlikely ways.

| Trump votes | Biden votes | Other votes | |
|---|---|---|---|
| Officially reported results | 6006429 (34.3%) | 11110250 (63.5%) | 384922 (2.2%) |
| Estimate of potential fraud | 1346000 (7.7%) | ||
| Estimate of actual result
(with fraud removed) |
6006429 (37.2%) | 9764250 (60.4%) | 384922 (2.4%) |
First takeaway on California – although California trended Democrat in registrations by 2%, Trump pushed it slightly right even in certified totals. This is only done with winning low-propensity voters, registered Democrats, independents, especially working class Hispanics in Southern California.
Trump gained 1,520,000 votes, 580k more than record Republican gain, but Democrats have DOUBLED their vote total since 2000, with Biden nearly 3 million over Obama in 2008.
These are worst counties for excess Biden votes as predicted by party ID, population growth, and registration:
| Alameda | 50k |
| Contra Costa | 50k |
| Fresno | 30k |
| Kern | 20k |
| L.A. | 500k |
| Orange | 100k |
| Riverside | 80k |
| San Bernardino | 40k |
| San Diego | 80k |
| Santa Clara | 60k |
| Ventura | 25k |
Proportionally, Los Angeles, Orange, Riverside, San Bernardino, and San Diego absolutely dwarf other counties for new registered voters. Are these phantom factories? Est. 1,346,000 excess Biden votes, would put state at 23.3% margin if only excess votes considered. I believe California to be much tighter.
Best audit targets: Kern, Shasta, Placer.
Source: https://t.me/CaptainKMapsandStats/2
Top 100 Worst Counties
Seth has listed California’s Fresno, Kern, Orange, and San Bernardino counties as being among the Nation’s Top 100 Worst Counties in terms of abnormal trends during the 2020 election.
San Diego County
Possible Voter Roll Manipulation
A number of states, both key competitive states, and not, have machined/trimmed/manipulated their voter rolls for the desired outcomes. Here are some examples:
CALIFORNIA – San Francisco didn’t seem to care much, expanding the rolls by just 9,000 voters (1.8%); but Orange, Riverside, San Bernardino, and San Diego were all about this election, with between 215k to 297k net new registered voters.
Previous highs since 2008:
| Orange: | 75k |
| Riverside: | 106k |
| San Bernardino: | 36k |
| San Diego: | 90k |
A deeper look into California has me questioning my own assessment of the state, as Trump improved tremendously in most of the major counties in the state, especially San Diego, LA, Orange, Riverside, and San Bernardino. California, as you know, is vital for the national popular vote propaganda piece for Democrats, and somehow manages to turn everything around it blue and still double its own Democrat votes in two decades with a now stagnant population growth. Can’t be both.
Source: https://t.me/ElectionHQ2024/788
Seth’s View on Recall Election Results
Events & Presentations
| Date | Presenter | Location | Link |
|---|---|---|---|
| Mon Oct 18, 2021 | Seth Keshel |
Whittier, Los Angeles, California | More info |
Further Updates
Methodology
Seth Keshel’s estimates are based on the percentage of voters who are registered to each party (where it’s possible to obtain this information) compared to the actual votes for each party. He examined these party trends over the last two decades, as well as population growth, which brought to light the strange and statistically unlikely outliers and anomalies that occurred in 2020. We explain this process, step by step, with visual examples, in our guide How to Predict Election Results Using Registration Data, so that you can investigate the numbers for yourself.
This video from Telegram also explains some of Seth’s approach to analyzing precincts.
Raw Data
We aim to publish links to both the raw election data and voter registration data for California so that citizens and researchers can analyze this information for themselves.
Other Reports
- A team of scientists from Election-Integrity.info produced the report “2020 Presidential Election Contrast Analysis” which lists California as the state with the highest number of unexpected Biden votes
Election Audit Groups on Telegram
Further updates from Seth Keshel can be found on his Telegram Channel @ElectionHQ2024.
To join the grassroots efforts in pursuing election integrity and audits of the 2020 election in California, you can join the following groups on Telegram:
- California Audit Force
- California Audit Force Discussion
- California One Six (helping Jan 6 political prisoners)
- California One Six Discussion (helping Jan 6 political prisoners)
- PatriotForceCA
For other states, see our Full List of Telegram Channels.
ElectionFraud20.org and Seth Keshel have no affiliation with nor any responsibility for these channels. Discern carefully, as some users and even admins of channels have shown obstruction to transparent audits of our elections.