See also the main article on Arizona, for documented election integrity issues, further reports, and updates on the Forensic Audit.
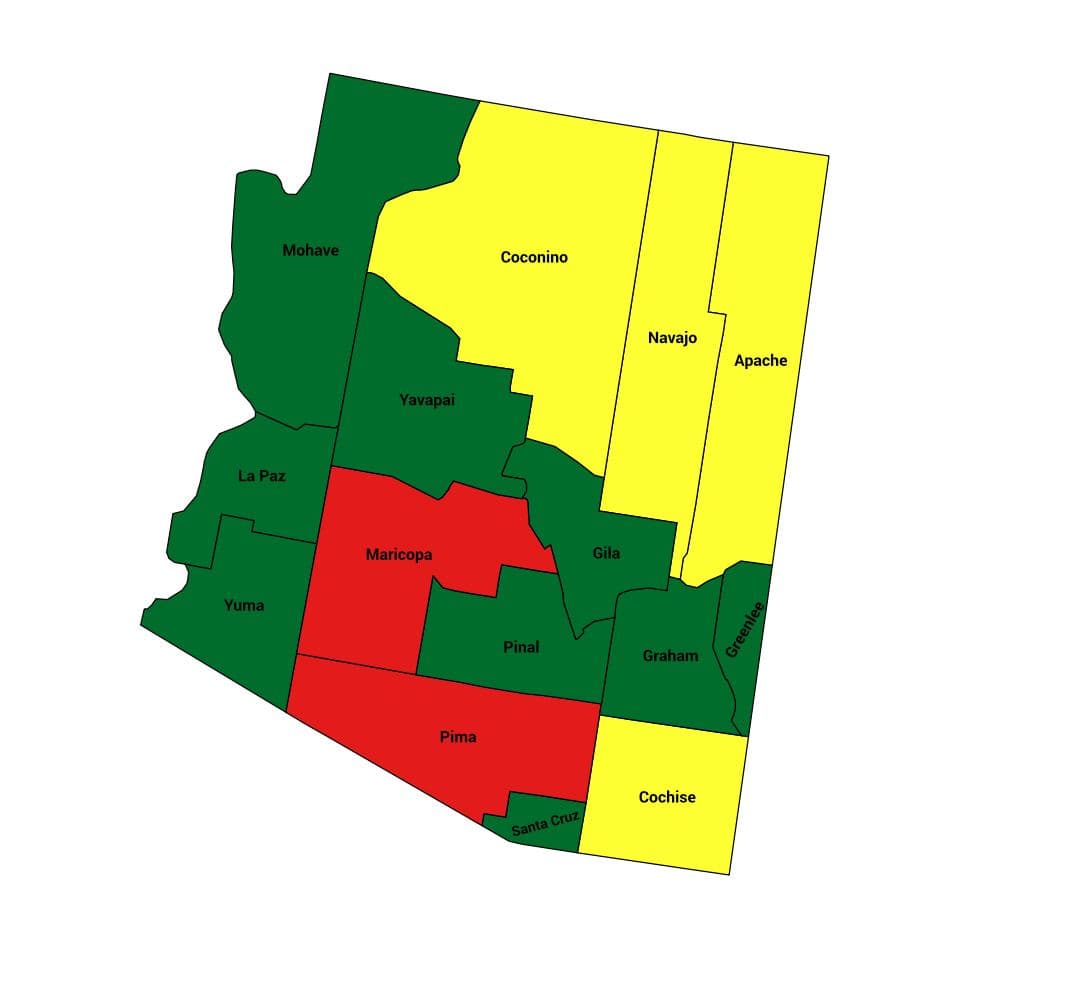
Former US military intelligence officer and statistical analyst Seth Keshel analyzed the trends of voter registrations versus actual votes. The following report indicates which counties’ vote counts align with the trend in voter registrations and which have small or large divergences. Each county is flagged as red, yellow, or green, based on whether the 2020 vote totals aligned with the expected trends (as past decades demonstrate they typically do), or if they diverged in statistically unlikely ways.

| Trump votes | Biden votes | Other votes | |
|---|---|---|---|
| Officially reported results | 1661686 (49.1%) | 1672143 (49.4%) | 50774 (1.5%) |
| Estimate of potential fraud | 210000 (6.2%) | ||
| Estimate of actual result
(with fraud removed) |
1661686 (52.3%) | 1462143 (46.1%) | 50774 (1.6%) |
Summary
-
No GOP candidate has ever exploded in votes like Trump in Arizona with a gain of 410,000 in a state that has been blue just once since 1948.
-
Trump set a GOP record in gaining of 248,000 new votes in Maricopa County, and yet still lost it (first Republican loss since 1972).
-
Biden gained a massive 511,000 votes in one election cycle, which blows away the previous record when Kerry added 209,000 in the first election of the higher turnout era in 2004, and yet Biden only won by 10,500 votes, which suggests they knew exactly how many votes they needed to dump into the mix to win
| Red | Obviously Ugly | 2 counties |
| Yellow | Suspect/Likely Fraud | 4 counties |
| Green | Clean | 9 counties |
Estimates for excess (potentially fraudulent) Biden votes based on population growth and new party registration data:
| Maricopa | 175k |
| Pima | 35k |
If Biden is 220,000 votes heavy in Arizona, counting only excess votes, Trump would have carried the state 52.4% to 45.8%, for a margin of 6.6%, which aligns with a Baris poll about 2 weeks before the election.
Source: https://t.me/CaptainKMapsandStats/10
Top 100 Worst Counties
Seth has listed Arizona’s Maricopa and Pima counties as being among the Nation’s Top 100 Worst Counties in terms of abnormal trends during the 2020 election.
Vote Surge in 2020
The following chart shows the surge in votes for Donald Trump in Arizona in 2020.
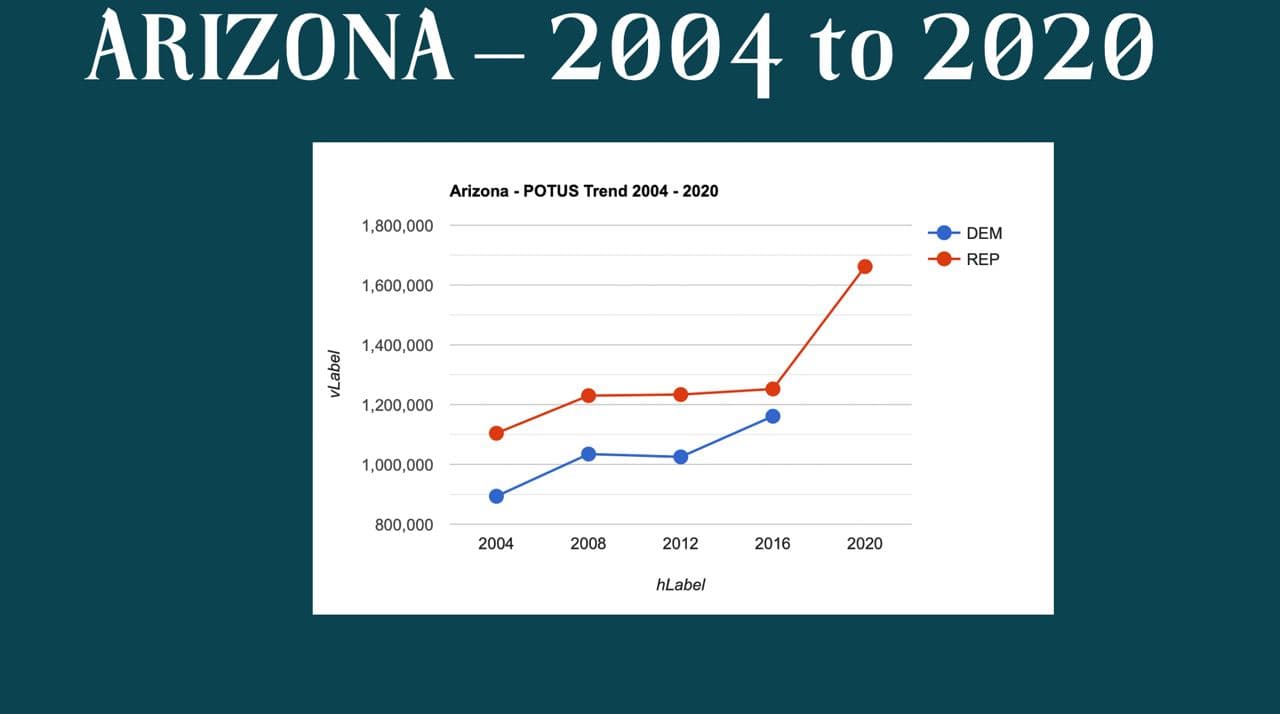
If election forecasting were a game of Blackjack, and the dealer had his one card face up, and that card was showing 409,000 more Trump votes than in 2016, and you saw a graph like this showing the GOP flat but still winning Arizona in every election of the high-turnout era (2004 to present)…
How much money would you have bet on Trump holding Arizona?
Remember that Obama gained 141k votes and Clinton gained 136k.
What would you expect Biden’s result to be?
Source: Telegram Post
Maricopa County
View Seth’s Maricopa County Report
See also: Maricopa Forensic Audit Results for a summary of the Cyber Ninjas forensic audit, including video presentations and links to the complete reports.
Pima County
View Seth’s Pima County Report
Cochise County
Cochise County, AZ is home to Fort Huachuca - an Army Intel Center and my former 2x duty station.
Here is an example of a county that is 4-5k heavy in Biden votes, potentially half the “margin” in AZ.

Source: Telegram Post, Aug 10, 2021
Gila County
Yavapai County
Further County Breakdowns
We’ve also analyzed some additional stats for counties in Arizona, being discussed in our Gitlab discussion area:
Video Updates on Arizona
Seth’s presentation on Arizona, with some specifics on Pima County, AZ:
Interview on Bannon’s War Room:
If anyone is able to assist with a written or dot-point summary of the above videos, we’d love to add those to this page. Connect on Telegram or Gitlab if you can assist.
Possible Voter Roll Manipulation
A number of states – both key competitive states and not – have machined/trimmed/manipulated their voter rolls for the desired outcomes. Here are some examples:
ARIZONA
| Maricopa County | 2004-08 | +179k | (+64k D, +16k R) |
| 2008-12 | +87k | (-34k D, - 6k R) | |
| 2012-16 | +344k | (+108k D, +86k R) | |
| 2016-20 | +433k | (+196k D, +148k R) | |
| Pima County | 2004-08 | +49k | (+21k D, +10k R) |
| 2008-12 | -1k | (-13k D, -4k R) | |
| 2012-16 | +48k | (+21k D, +9k R) | |
| 2016-20 | +96k | (+52k D, +22k R) |
Katie Hobbs is almost certainly stuffing voter rolls with phantoms, not just with Maricopa, but Pima, too. Arizona needs to do a thorough canvassing – we have a historically red state with historic Republican gains in registration, that has been growing a lot for decades, with numbers this lopsided. Maricopa looks like it may have also been manipulated in 2016.
Source: https://t.me/ElectionHQ2024/788
Further Reports
Methodology
Seth Keshel’s estimates are based on the percentage of voters who are registered to each party (where it’s possible to obtain this information) compared to the actual votes for each party. He examined these party trends over the last two decades, as well as population growth, which brought to light the strange and statistically unlikely outliers and anomalies that occurred in 2020. We explain this process, step by step, with visual examples, in our guide How to Predict Election Results Using Registration Data, so that you can investigate the numbers for yourself.
This video from Telegram also explains some of Seth’s approach to analyzing precincts.
Raw Data
We aim to publish links to both the raw election data and voter registration data for Arizona so that citizens and researchers can analyze this information for themselves.
Other Reports
-
A team of scientists from Election-Integrity.info produced the following reports:
-
“2020 Presidential Election Startling Vote Spikes” which includes a section on Arizona
-
“2020 Presidential Election Contrast Analysis” which includes a section on Arizona
-
-
See also the main Arizona article for more
Election Audit Groups on Telegram
Further updates from Seth Keshel can be found on his Telegram Channel @ElectionHQ2024.
To join the grassroots efforts in pursuing election integrity and audits of the 2020 election in Arizona, you can join the following groups on Telegram:
- ArizonaAudit
- ARIZONA_AUDIT
- Arizona Audit Force
- ArizonaAuditLiveFeeds
- Arizona Red Roots
- AZAuditWatch
- Representative Mark Finchem
- Senator Kelly Townsend
- Senator Wendy Rogers
For other states, see our Full List of Telegram Channels.
ElectionFraud20.org and Seth Keshel have no affiliation with nor any responsibility for these channels. Discern carefully, as some users and even admins of channels have shown obstruction to transparent audits of our elections.