See also the main article on Oregon, for documented election integrity issues and further reports.
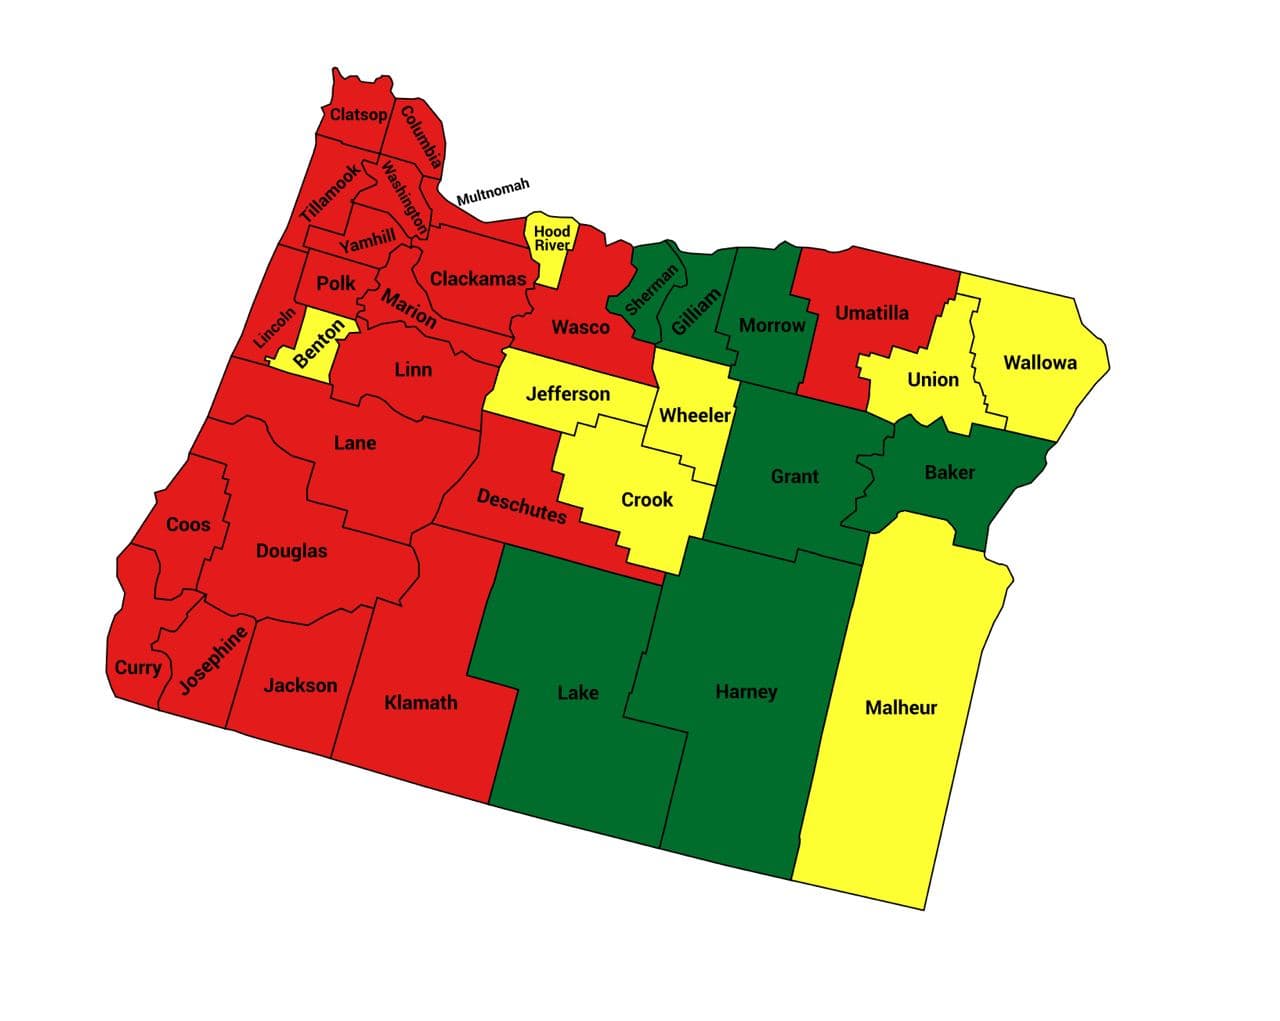
Former US military intelligence officer and statistical analyst Seth Keshel analyzed the trends of voter registrations versus actual votes. The following report indicates which counties’ vote counts align with the trend in voter registrations and which have small or large divergences. Each county is flagged as red, yellow, or green, based on whether the 2020 vote totals aligned with the expected trends (as past decades demonstrate they typically do), or if they diverged in statistically unlikely ways.

| Trump votes | Biden votes | Other votes | |
|---|---|---|---|
| Officially reported results | 958448 (40.37%) | 1340383 (56.45%) | 75508 (3.18%) |
| Estimate of potential fraud | 217000 (9.1%) | ||
| Estimate of actual result
(with fraud removed) |
958448 (44.4%) | 1123383 (52.1%) | 75508 (3.5%) |
Oregon statewide moved slightly Republican in terms of party registration numbers — 30 out of 36 counties had more Republican party registrations than Democrat ones, since 2016. As such, we should have seen the Democrats have an even smaller winning margin than the 10.98% margin seen in 2016. But instead it jumped to over 16%! How did Trump lose another 5+ percentage points while gaining 176,000 votes from 4 years earlier?
I estimate that Biden has 162k more votes than would be reasonably expected, and that’s before even counting Multnomah! Here are the worst ones:
| Clackamas | 15k |
| Jackson | 12k |
| Lane | 20k |
| Marion | 17k |
| Washington | 31k |
| Multnomah | 55k |
| Others… | 67k |
| Total | 217k |
Biden was +84k in Multnomah after gains of +18k and -5k in last two elections. Estimate 55k there, for total of 217k excess. If correct, that give us an accurate election tally in that state with Biden’s margin at +7.6%. That’s only considering excess Biden votes in opposition to established registration trends.
The best targets for audits are Umatilla, Linn, Jackson, and Yamhill. Blue states had to be pushed back out to double digit margins to distract from Rust Belt operation.
Source: https://t.me/CaptainKMapsandStats/4
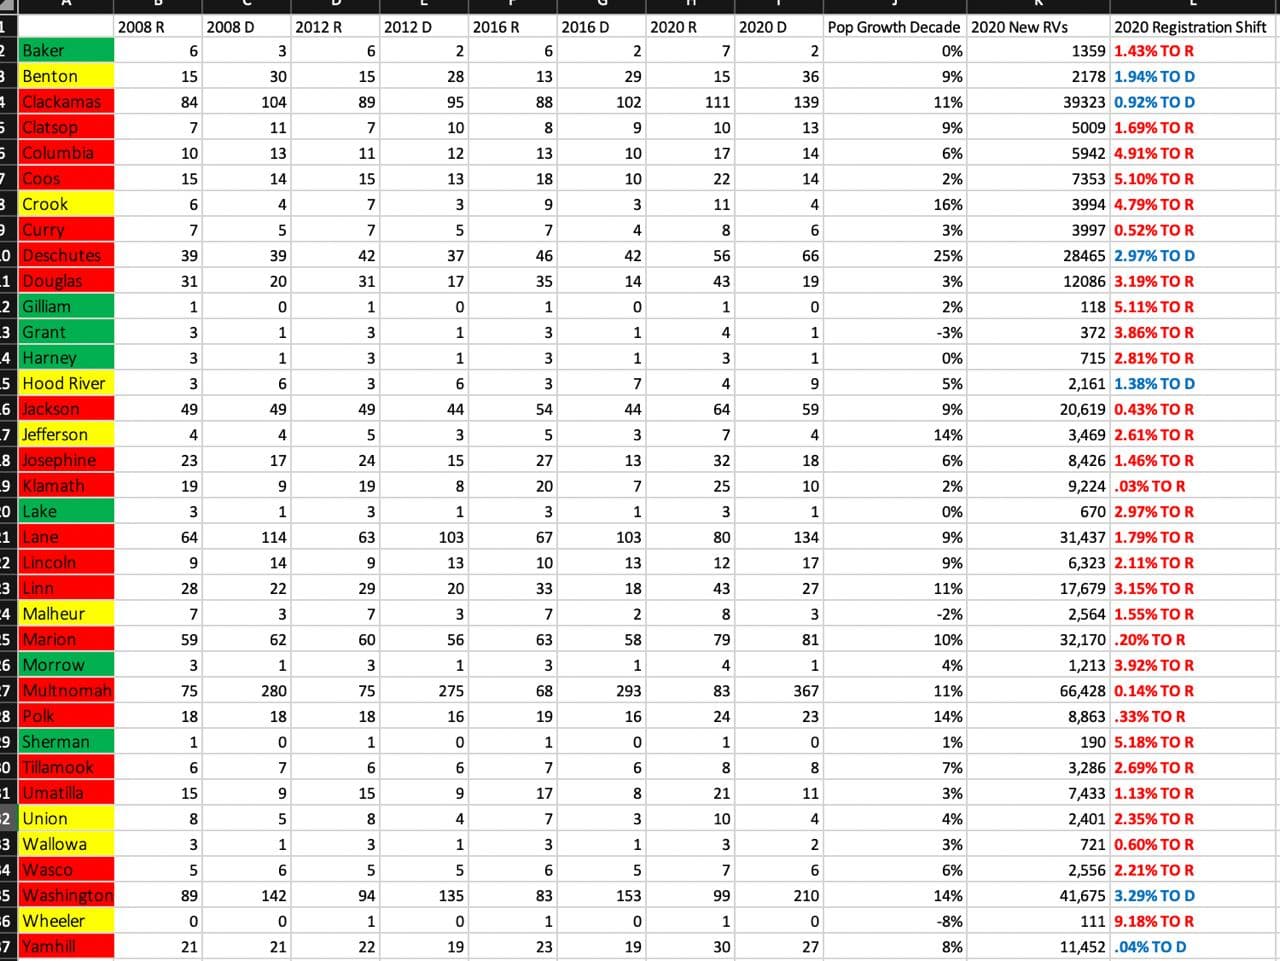
Stats By County
Source: https://t.me/CaptainKMapsandStats/4
Top 100 Worst Counties
Seth has listed Oregon’s Jackson and Marion counties as being among the Nation’s Top 100 Worst Counties in terms of abnormal trends during the 2020 election.
Jackson County
Linn County
Seth explains the registration vs vote trends since 2004 and why he estimates that Linn County has 8,000 more votes for Biden than seems rational:
Source: Telegram Post, Sep 13, 2021
Umatilla County
Seth explains how, with the aid of motor voter and mail-in voting, Biden is at least 3,000 votes higher than any reasonable forecast would allow for.
County Type: CRIMSON (Trump’s win was bigger than Romney’s win)
Source: Telegram post, Jan 14, 2022
Washington County
Possible Voter Roll Manipulation
A number of states, both key competitive states, and not, have machined/trimmed/manipulated their voter rolls for the desired outcomes. See New Hampshire, Alaska, California, and Arizona.
There are other states with bloated rolls, like Florida and Texas. Colorado doesn’t show much movement in the two parties but tons of new registered indies/others, along with Washington and Oregon. Pennsylvania and North Carolina appear to have let their party rolls run clean, showing a tremendous beating getting ready to be done by Trump, but pulled things off differently.
Phantoms.
Source: https://t.me/ElectionHQ2024/788
Unexpected Surge in Mail-In Ballots
Events & Presentations
| Date | Presenter | Location | Link |
|---|---|---|---|
| Sat Sep 11, 2021 | Seth Keshel |
Oregon | More info |
Further Updates
-
Troy Smith, representing Kim Thatcher, Oregon State Representative, spoke at the Cyber Symposium (view video, starting around 2hr 55min mark) saying:
- In Oregon, they are wanting to look into the concerns
- Constitution says that state legislatures have their role in election, but it’s currently Democrat-controlled. We really need a “We the people” movement.
- We need to open our eyes, be open-minded, but with healthy skepticism
- He’s really thinking about the chain of custody and the vulnerabilities
- The codes and PCAPs are over their heads, and it’s too hard to look into
- The problem: they have to prove there was a murder before they can even get an investigation
- It’s reasonable to have transparency
Methodology
Seth Keshel’s estimates are based on the percentage of voters who are registered to each party (where it’s possible to obtain this information) compared to the actual votes for each party. He examined these party trends over the last two decades, as well as population growth, which brought to light the strange and statistically unlikely outliers and anomalies that occurred in 2020. We explain this process, step by step, with visual examples, in our guide How to Predict Election Results Using Registration Data, so that you can investigate the numbers for yourself.
This video from Telegram also explains some of Seth’s approach to analyzing precincts.
Raw Data
We aim to publish links to both the raw election data and voter registration data for Oregon so that citizens and researchers can analyze this information for themselves.
Election Audit Groups on Telegram
Further updates from Seth Keshel can be found on his Telegram Channel @ElectionHQ2024.
To join the grassroots efforts in pursuing election integrity and audits of the 2020 election in Oregon, you can join the following groups on Telegram:
- Oregon Audit Force
- Oregon Audit Force Discussion
- Oregon One Six (helping Jan 6 political prisoners)
- Oregon One Six Discussion (helping Jan 6 political prisoners)
For other states, see our Full List of Telegram Channels.
ElectionFraud20.org and Seth Keshel have no affiliation with nor any responsibility for these channels. Discern carefully, as some users and even admins of channels have shown obstruction to transparent audits of our elections.