📃 This case study is based on the method we described in How to Predict Election Results Using Registration Data.
Maricopa County, Arizona
The Maricopa County forensic audit report was presented on Fri Sept 24, 2021.
Read more about their findings.
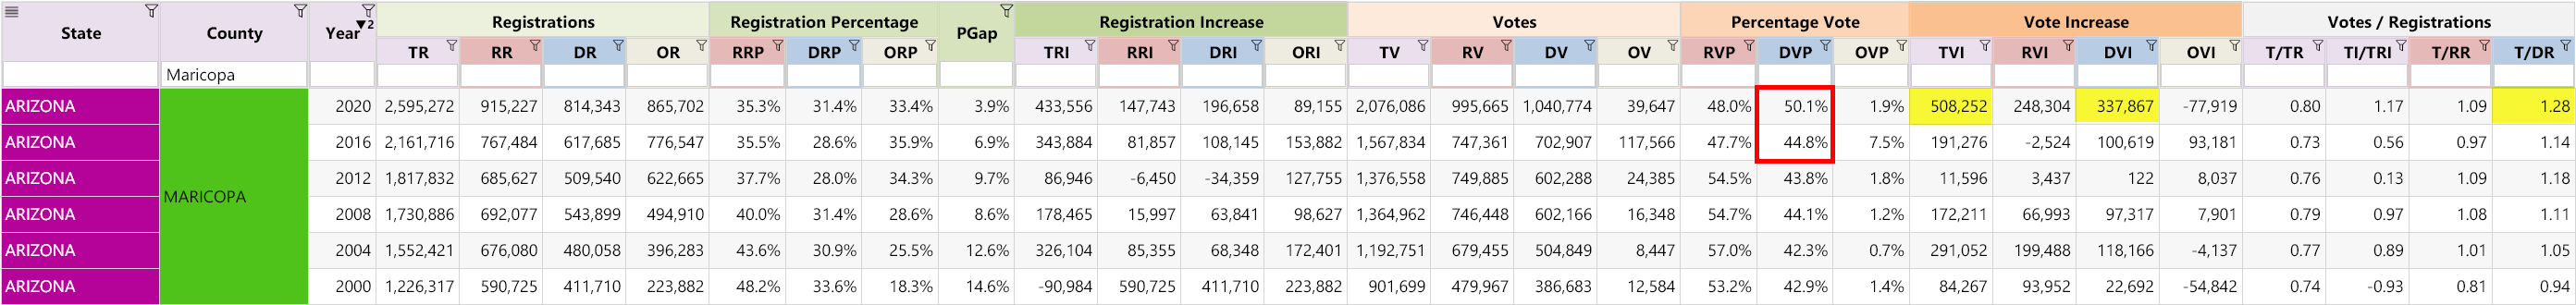
Maricopa is one of the largest counties in America with a total of 2,076,086 votes in 2020.
Observations:
- Maricopa county voted Democrat for the first time in 2020 in a very long time.
- Dramatic increase in DVP. (Over 5% in one election cycle…)
- Huge DVI increase in 2020. Nearly 3 times larger than the previous record set in 2004.
- T/DR: Set a new record in 2020 at 1.28
Analysis:
If we were to use a more realistic T/DR ratio of 1.10 (which is in line with the historical downward trend), we can estimate the Democrat excess votes.
| Estimate Democrat Votes (EDV): | DR * T/DR = | 814,343 * 1.10 = | 895,777 |
| Excess Democrat Votes: | DV - EDV = | 1,040,774 - 895,777 = | 144,997 |
This number is conservative as it does not account for the excessive new Democrat and “Other” registrations in 2020.
In fact, we find the DVI increase of 337,867 to be extremely high. That is 219,701 more votes than the previous record set in 2008. (That is nearly 3 times more votes than the previous record!)
It is also 237,248 more votes than the 2016 DVI value.
This number is suspiciously close to the 255,326 number Doug Logan mentioned in his audit presentation. This number represents the early votes that are recorded in the VM55 final voter file, but do not have a corresponding EV33 entry (in the Early Voting Returns file. This file keeps records of the date the ballot was returned and the method. i.e. by mail or in-person).
Here is a screenshot from Doug Logan’s audit presentation:
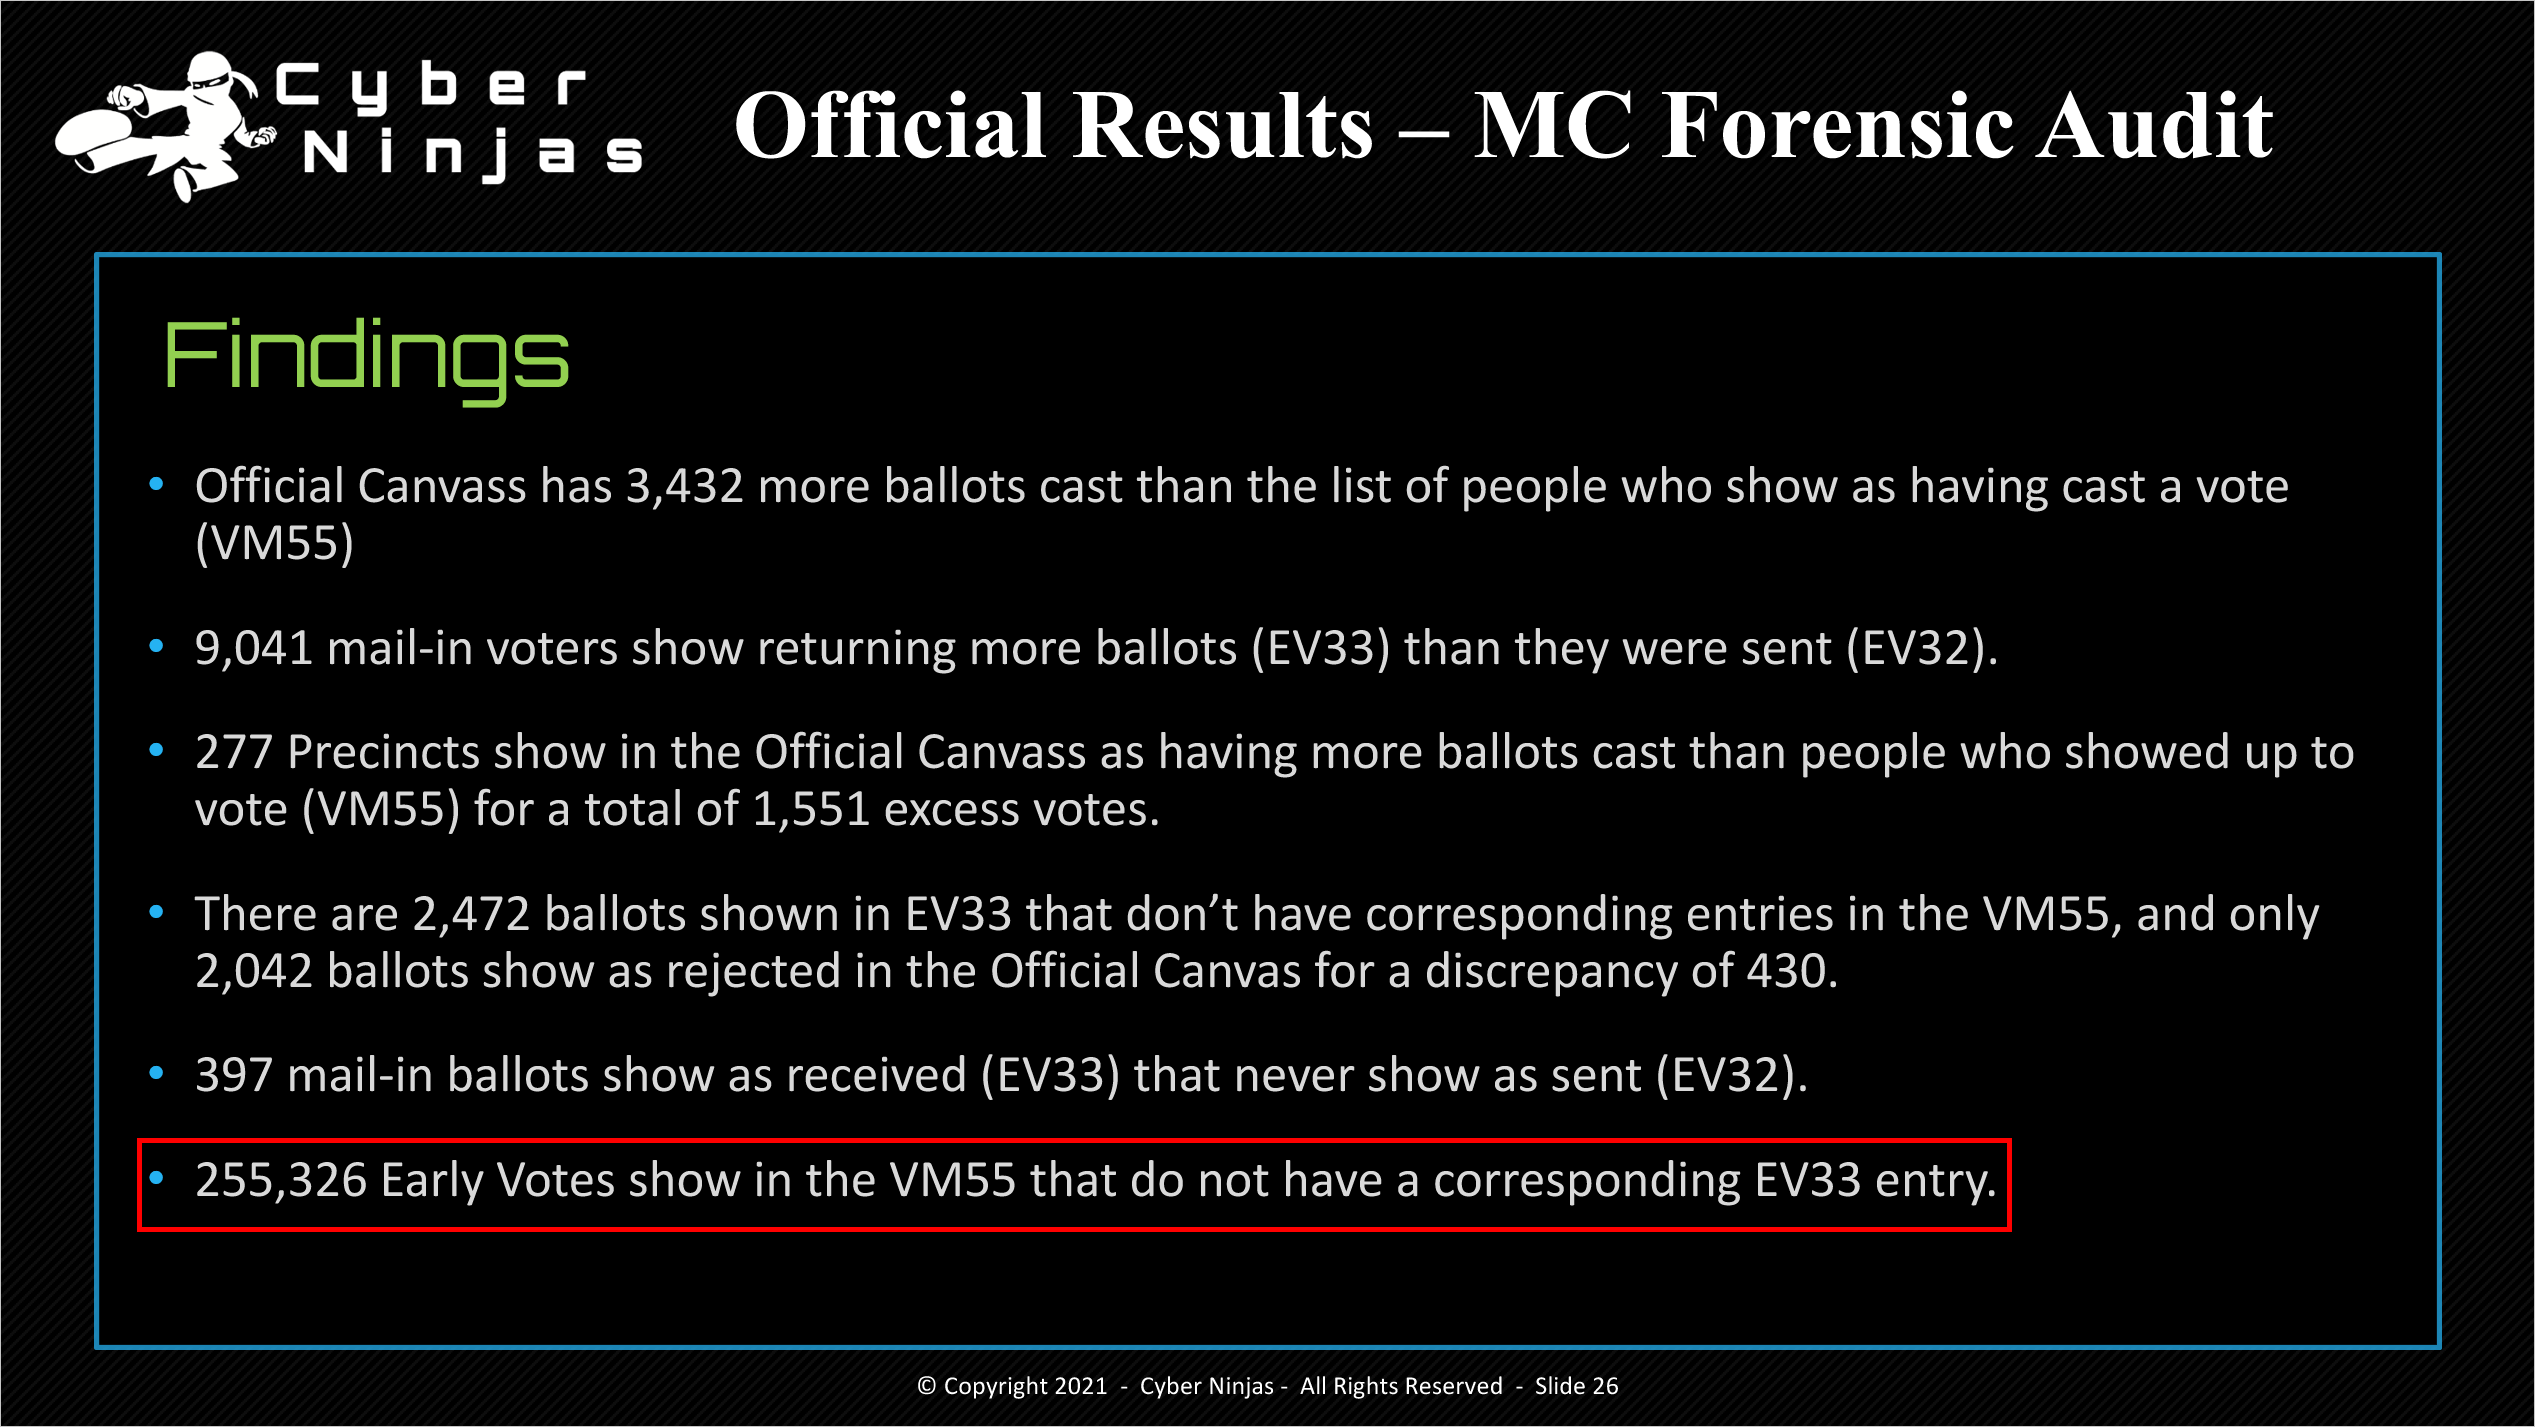
⚠️ How is it possible that vote entries end up in the final voter file (VM55), but have no corresponding entries in the EV33 file? They literally “magically” appeared in the final vote tally, and no one knows how they got there…
Furthermore, in the official Cyber Ninja Volume III report, we find the following paragraphs on Corrupt Ballot Images (page 70 - 73). These paragraphs are worth reading very carefully. The implications are startling:
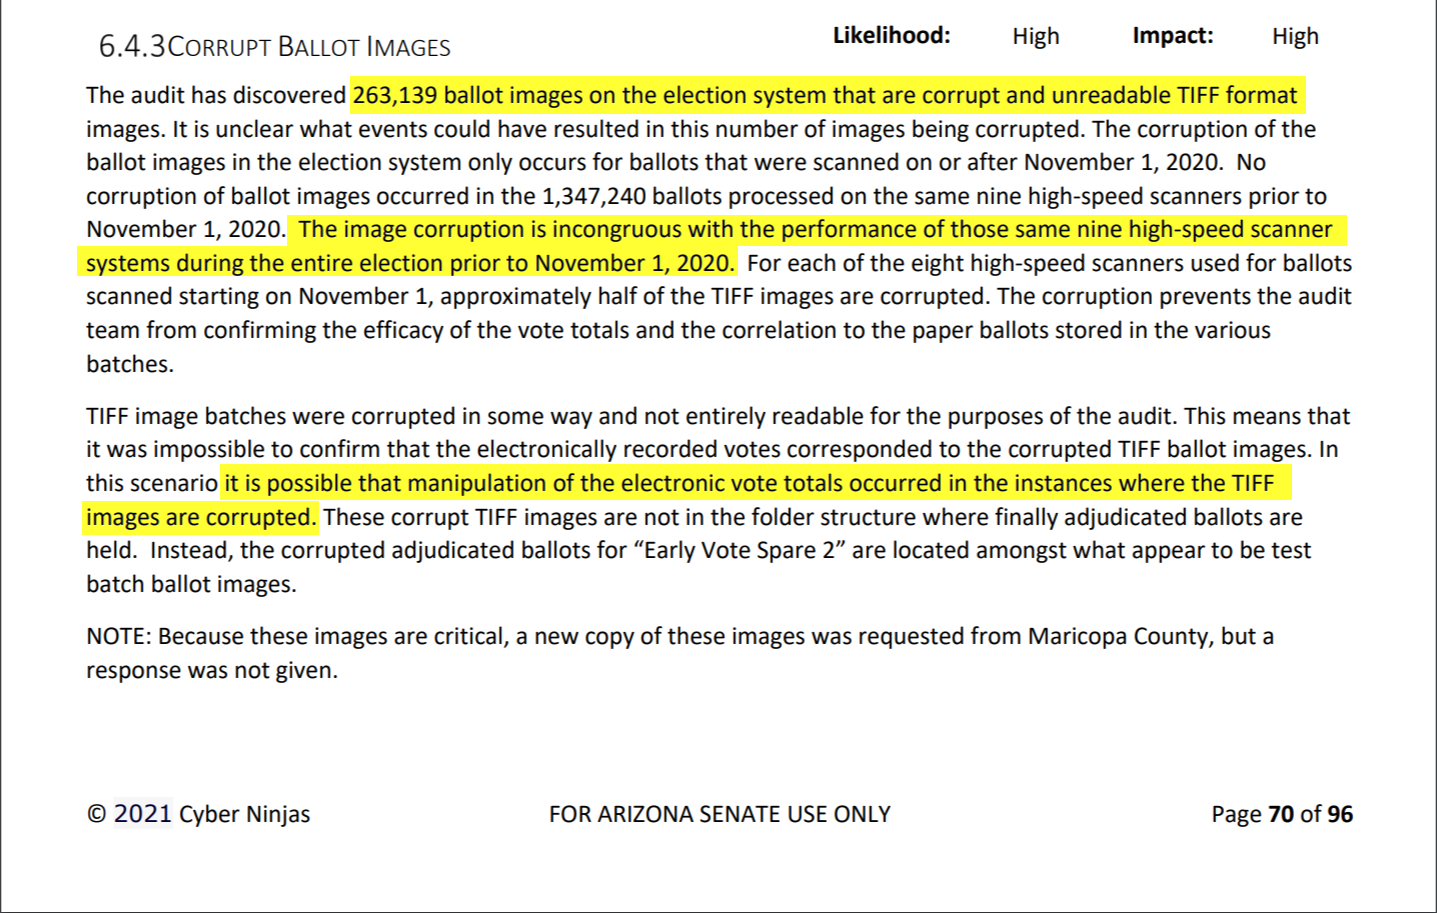
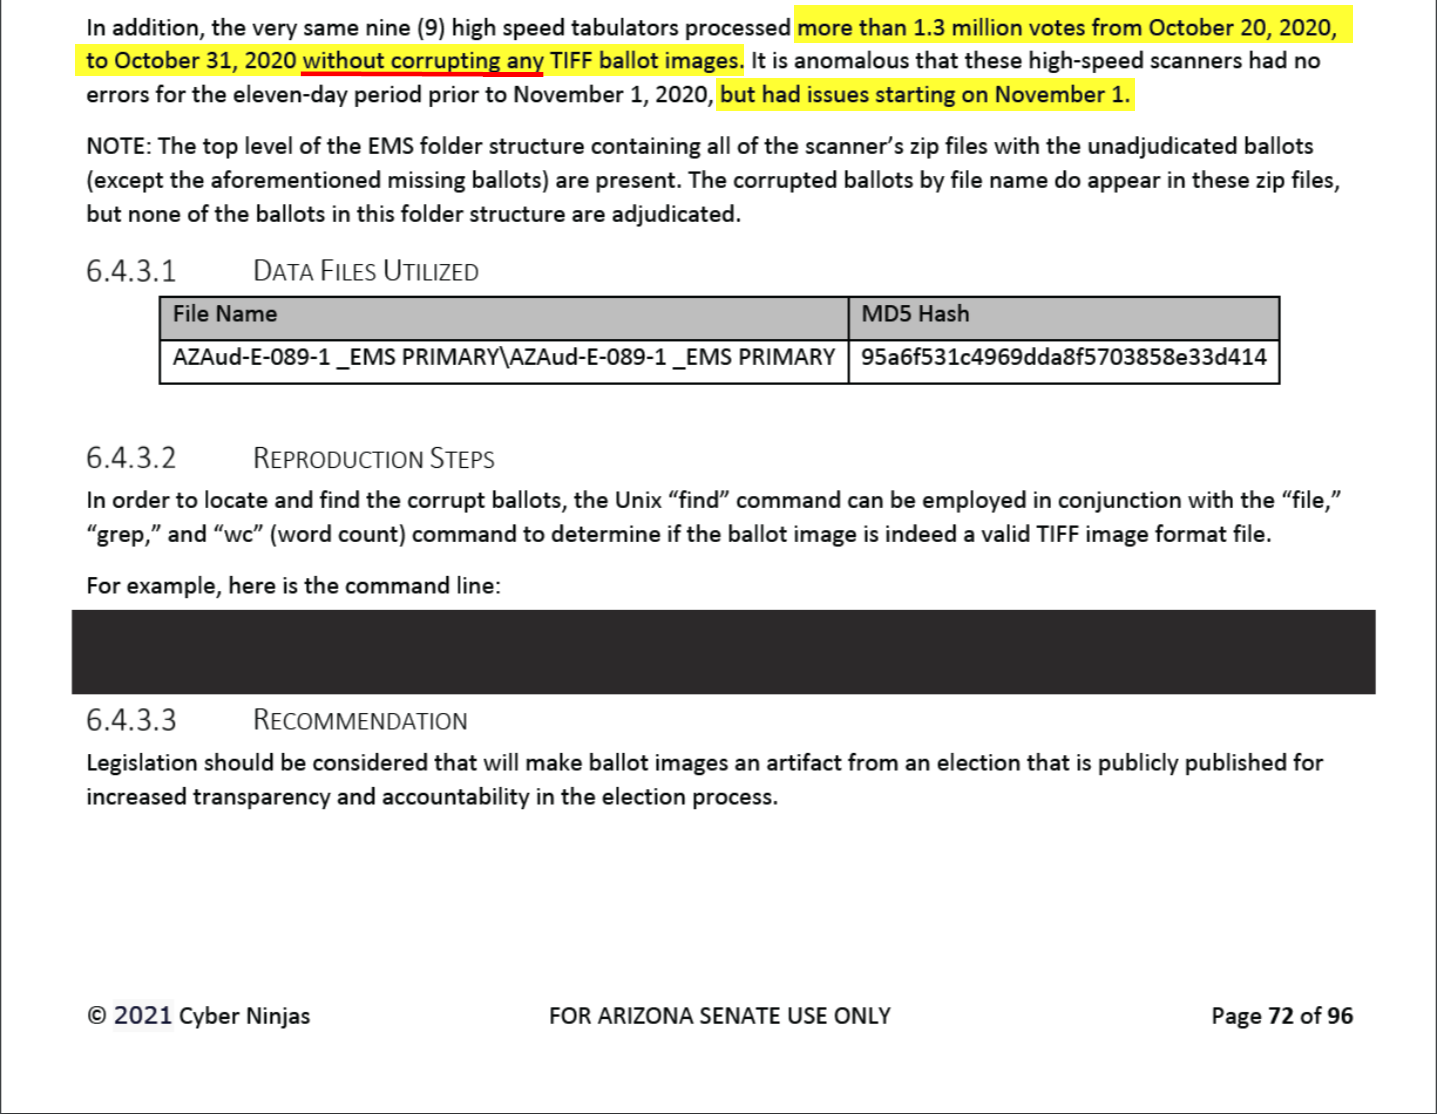
This is no coincidence. The number of corrupt ballots nearly matches the number of “magic” votes, which also matches our data analysis. This represents a perfect triangulation of independent observations (also known as a “Nomological network”) all pointing to the same conclusion… There are over 250K votes and ballots that are unaccounted for!
⚠️ As an aside, this would also suggest the formula we use for calculating excess votes from the T/DR value is too lenient.
For further similar case studies, see: Florida and Maryland
Other Articles In This Series
| Overview | Diving deeper into the unusual trends and statistics discovered in the 2020 election. |
| Part 1 | A look at the surprising failure of the bellwether counties in 2020, and what that tells us about the Presidential election outcome. |
| Part 2 | The data shows the Democrats are winning less and less counties at each election, but are winning more and more of the largest counties. How is this possible? |
| Part 3 | Voter turnout rates shot up dramatically in many states in 2020. We look at the voting rates since 2000 to find out which states set a new record. |
| Part 4 | Learn how to "normalize" a county's winning margin to identify abnormalities. What does this reveal about the 2020 election? |
| Part 5 | Learn how to use the party registration numbers for each county to predict the election results for a state and assess the likely validity of the results. This is a guide on the method Seth Keshel uses for his predictions and county heat maps, allowing you to dig into the trends of your own county and uncover anomalies. |
| Part 6 | We build on some of the previous techniques to scan 3,111 American counties, identifying those whose shift in vote totals moves unexpectedly against the shift in party registrations. |
| Part 7 | We compare the Democrat vote totals with previous elections which reveal some very large increases in unlikely places. |
| Part 8 | We compare key parameters in the 2020 results against the previous five elections using the z-score, and find hundreds of counties breaking statistical norms. |
| Part 9 | Interesting statistical findings on how the Presidential race results compared to the other races in the same election. |
| Part 10 |
Voter Roll Analysis
Coming soon.
|
| Part 11 |
The Art of the Steal
Coming soon.
|
Follow us on Telegram to be notified when we release the remaining articles.
Visitor Comments
Have any thoughts or feedback on the data presented above? Let us know in the comments below.