See also the main article on Minnesota, for documented election integrity issues and further reports.
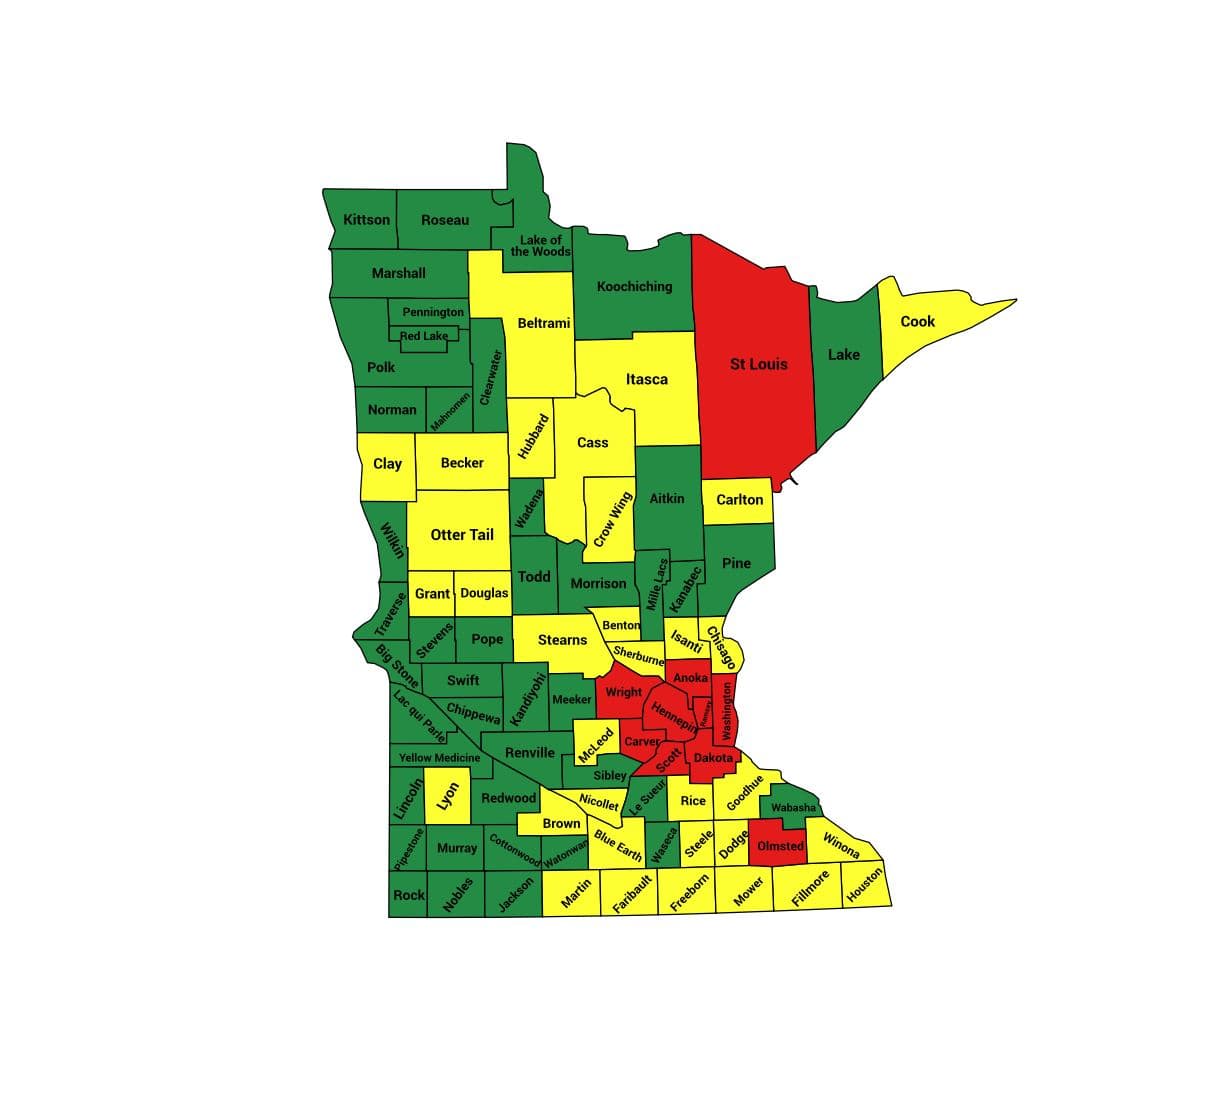
Former US military intelligence officer and statistical analyst Seth Keshel analyzed the trends of voter registrations versus actual votes. The following report indicates which counties’ vote counts align with the trend in voter registrations and which have small or large divergences. Each county is flagged as red, yellow, or green, based on whether the 2020 vote totals aligned with the expected trends (as past decades demonstrate they typically do), or if they diverged in statistically unlikely ways.

| Trump votes | Biden votes | Other votes | |
|---|---|---|---|
| Officially reported results | 1484065 (45.28%) | 1717077 (52.40%) | 76023 (2.32%) |
| Estimate of potential fraud | 228000 (7.0%) | ||
| Estimate of actual result
(with fraud removed) |
1484065 (48.7%) | 1489077 (48.8%) | 76023 (2.5%) |
Trump is up 161k votes from 2016 as the state nearly dropped into the GOP column, but Biden is up 349k after two consecutive elections of fewer votes, including Clinton down 178k from Obama’s re-election. They will gain votes in 2020 thanks to third parties returning.
Fair share of green counties here, but there are a ton of rural, tiny counties with little play in numbers. Hennepin is a cesspool, and Ramsey a smaller version. Biden is 2x Obama’s high turnout era record gain, plus another 30k. I’ve afforded him Obama ’08 gain plus 25%, same as Ramsey, almost certainly high.
If Biden is 228k heavy, Trump would be within 5k votes, at 0.1% margin. I suspect I’m way light on Hennepin, and believe this was a 1-3 point Trump state. Ellison told you at 4 PM on 11/3 he didn’t have the votes.
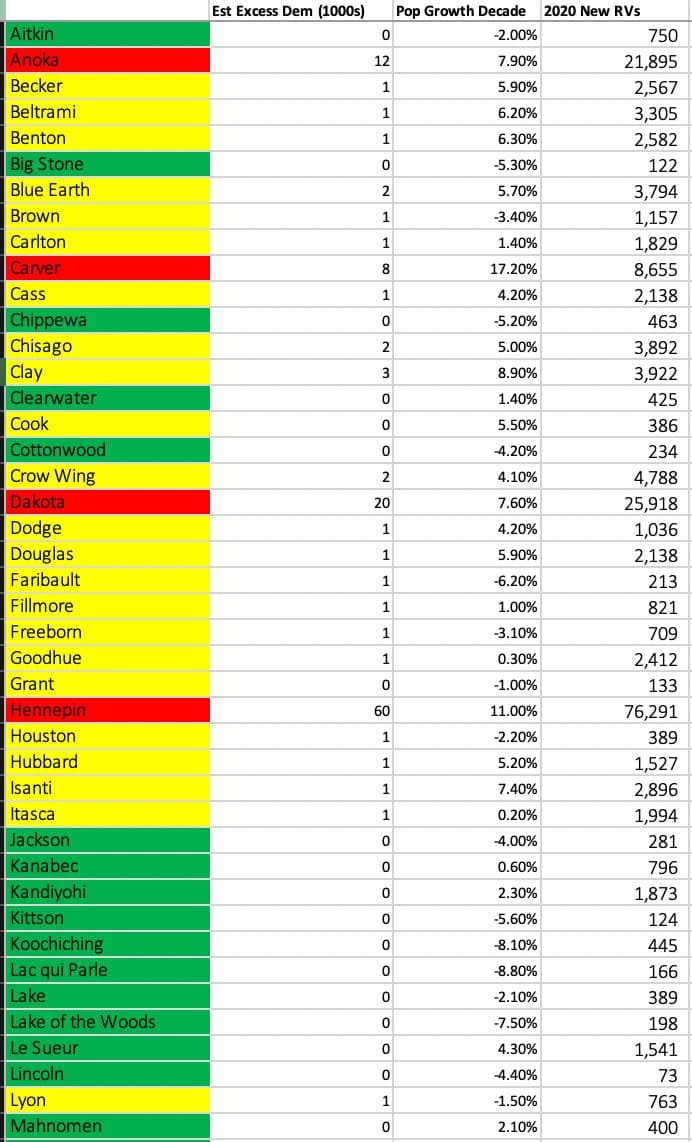
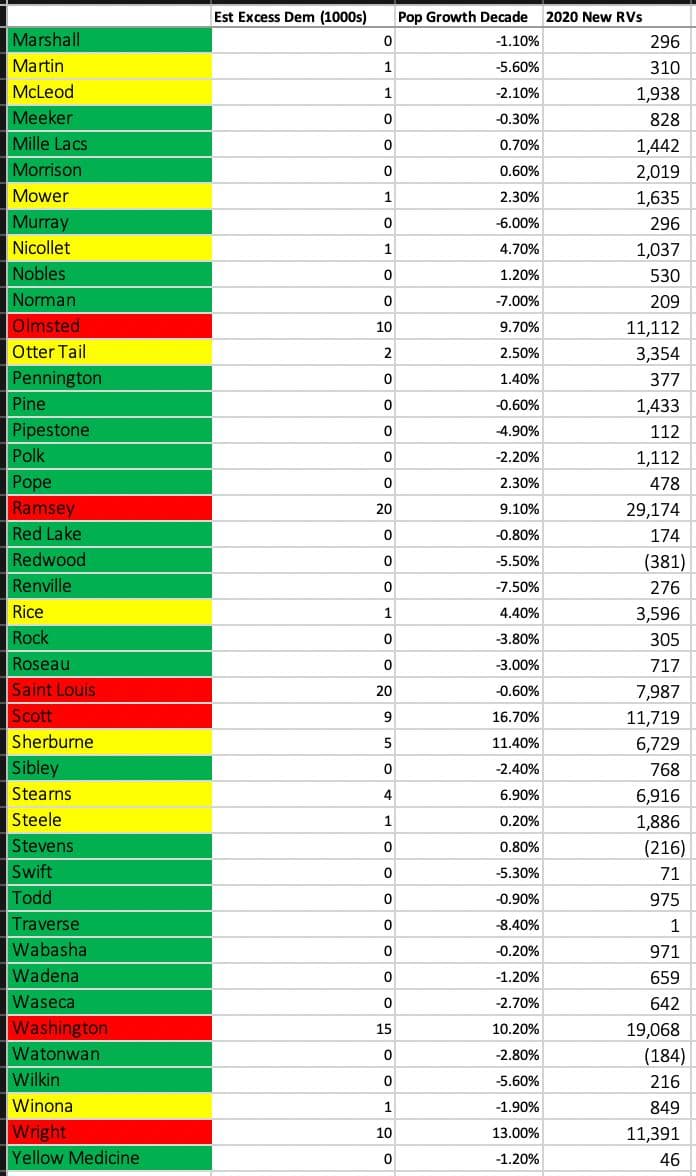
Best targets for audits: Anoka (12k), Carver (8k), Scott (9k), Wright 10k
Source: https://t.me/CaptainKMapsandStats/83
Top 100 Worst Counties
Seth has listed Minnesota’s Anoka, Dakota, Hennepin, Ramsey, Saint Louis, and Wright counties as being among the Nation’s Top 100 Worst Counties in terms of abnormal trends during the 2020 election.
Stats By County
Source: https://t.me/CaptainKMapsandStats/83
Further Points
-
Minnesota resembles Wisconsin; Pennsylvania/Michigan resemble each other. Third party vote very swingy coming back to two parties in Minnesota.
-
I have Trump down to the wire here, with Biden well over what I would call 200k excess expected votes.
-
I have been generous to Biden, allowing 125% of Obama’s historic high turnout era (2004-present) gains in Hennepin and Ramsey.
-
St. Louis County is way too high for Biden under recent trends, enough for local Dem mayors to endorse Trump in Iron Range.
-
AG Ellison tweeted late in afternoon of 11/3 they didn’t have the votes to win the state, just before they won the Obama-Romney race margin, after Trump spent big time there and campaigned?
-
Wisconsin and Minnesota were 7-8% Obama states in 2012 and Minnesota 2.3% left of Wisconsin in 2016. I have Wisconsin to Trump at 3.7%. I’m sure I’m light in Twin Cities and would expect it to tilt to Trump up to as much as 2.5%.
-
Lewis won the Senate seat with numbers like this.
Source: https://t.me/ElectionHQ2024/512
Charting the Abnormal Trend
Crow Wing County
The following video contains Seth’s presentation in Brainerd, Crow Wing County, Dec 9, 2021. Full event runtime: 3hrs 42min.
Download Seth’s Presentation Slides
The following PDF shows a map of which precincts in the county had the most abnormal results in 2020:
Ramsey County
Wright County
Here is Seth’s Presentation in Monticello, Wright County, Feb 22, 2022. Seth begins at 6min 15sec mark. Full runtime: 3hrs 5min.
Additional Reports and Updates
Events & Presentations
| Date | Presenter | Location | Link |
|---|---|---|---|
| Tue Feb 22, 2022 | Seth Keshel |
Monticello, Wright County, Minnesota | More info |
| Tue Nov 9, 2021 | Seth Keshel |
Brainerd, Minnesota | More info |
Methodology
Seth Keshel’s estimates are based on the percentage of voters who are registered to each party (where it’s possible to obtain this information) compared to the actual votes for each party. He examined these party trends over the last two decades, as well as population growth, which brought to light the strange and statistically unlikely outliers and anomalies that occurred in 2020. We explain this process, step by step, with visual examples, in our guide How to Predict Election Results Using Registration Data, so that you can investigate the numbers for yourself.
This video from Telegram also explains some of Seth’s approach to analyzing precincts.
Raw Data
We aim to publish links to both the raw election data and voter registration data for Minnesota so that citizens and researchers can analyze this information for themselves.
Other Reports
A team of scientists from Election-Integrity.info produced the following reports:
-
“2020 Presidential Election Startling Vote Spikes” which includes a section on Minnesota
-
“2020 Presidential Election Contrast Analysis” which lists Minnesota as the state with the 9th highest number of unexpected Biden votes
Election Audit Groups on Telegram
Further updates from Seth Keshel can be found on his Telegram Channel @ElectionHQ2024.
To join the grassroots efforts in pursuing election integrity and audits of the 2020 election in Minnesota, you can join the following groups on Telegram:
- Minnesota Audit Force
- Minnesota Audit Force Discussion
- Minnesota One Six (helping Jan 6 political prisoners)
- Minnesota One Six Discussion (helping Jan 6 political prisoners)
- MNAuditChat
For other states, see our Full List of Telegram Channels.
ElectionFraud20.org and Seth Keshel have no affiliation with nor any responsibility for these channels. Discern carefully, as some users and even admins of channels have shown obstruction to transparent audits of our elections.