See also the main article on Michigan, for documented election integrity issues and further reports.
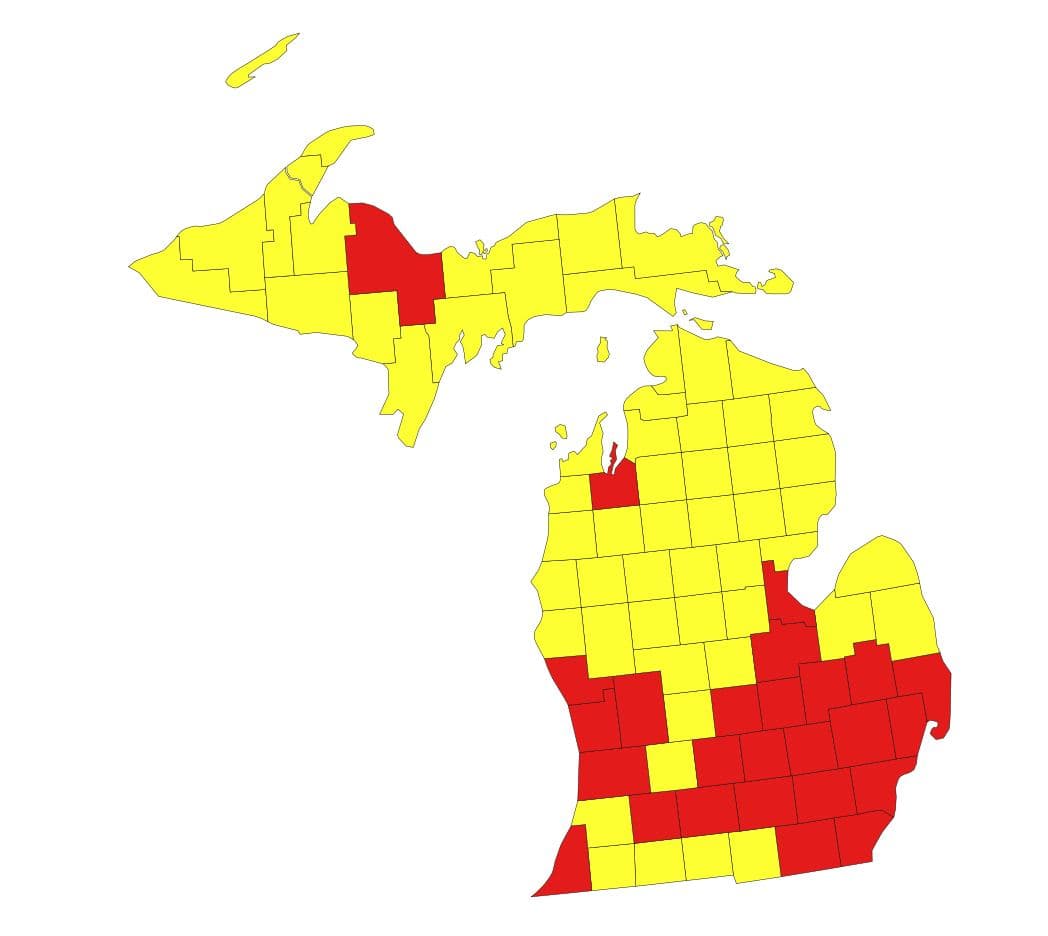
Former US military intelligence officer and statistical analyst Seth Keshel analyzed the trends of voter registrations versus actual votes. The following report indicates which counties’ vote counts align with the trend in voter registrations and which have small or large divergences. Each county is flagged as red, yellow, or green, based on whether the 2020 vote totals aligned with the expected trends (as past decades demonstrate they typically do), or if they diverged in statistically unlikely ways.

| Trump votes | Biden votes | Other votes | |
|---|---|---|---|
| Officially reported results | 2649852 (47.8%) | 2804040 (50.6%) | 88665 (1.6%) |
| Estimate of potential fraud | 527000 (9.5%) | ||
| Estimate of actual result
(with fraud removed) |
2649852 (52.8%) | 2277040 (45.4%) | 88665 (1.8%) |
Michigan tracks Pennsylvania in terms of voter tendencies; since 2008, declining Democrat participation and increasing Republican, especially under Trump. Obama lost 303k in 2012, Clinton another 296k. Trump gained 370k amidst this coalition shift in a shrinking state, only to be lapped by Biden with 535k after no new net positive Democrat votes in 12 years.
As a general rule, states in population decline with a massive coalition shift (party switching) going on are not going to show massive gains for both sides. The counties in Michigan all track with Pennsylvania counties. Not one clean county here – an easy Trump win as we saw on 11/3 in progress.
If Biden is 527k heavy, Trump margin of victory in Michigan was about 52.9% to 45.4%, or 7.5% overall (373k votes).
Best targets for audits: Macomb, Allegan, Bay, Berrien, Calhoun, Clinton, Eaton, Jackson, Kent, Livingston, Monroe, Muskegon, Ottawa, Saginaw, St. Clair
Source: https://t.me/CaptainKMapsandStats/79
Top 100 Worst Counties
Seth has listed Michigan’s Genessee, Kent, Livingston, Macomb, Oakland, Washtenaw, and Wayne counties as being among the Nation’s Top 100 Worst Counties in terms of abnormal trends during the 2020 election.
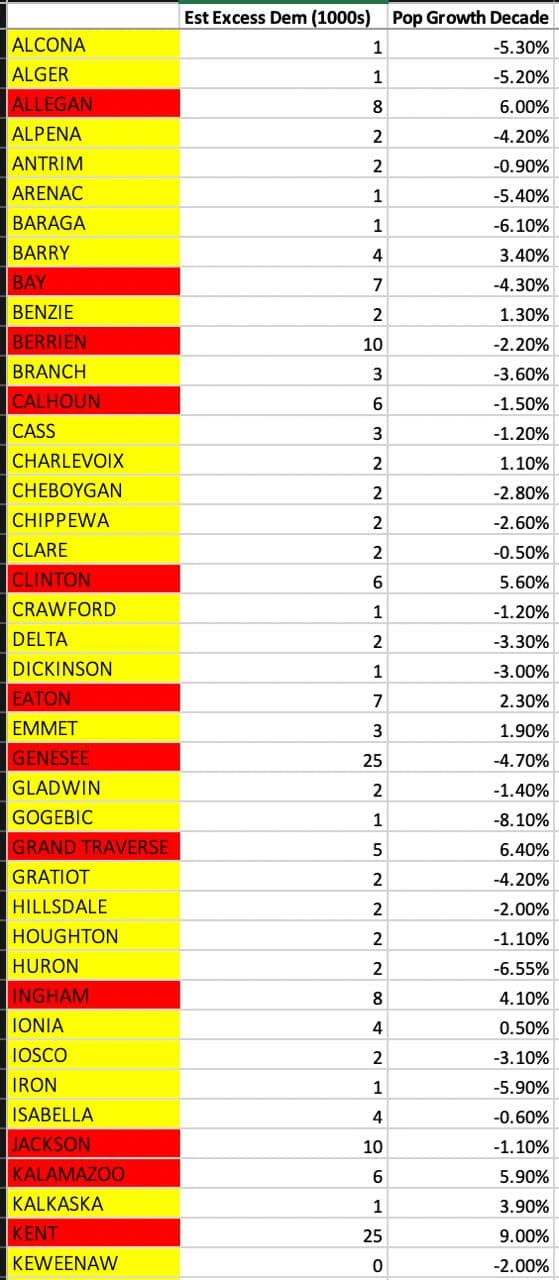
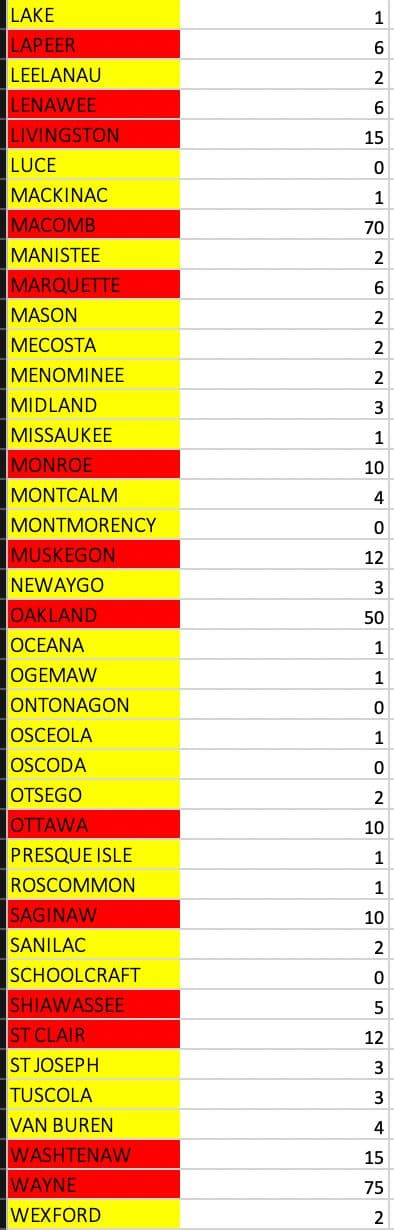
Stats By County
Source: https://t.me/CaptainKMapsandStats/79
Detailed Report
Improbable Voting Trend Reversals in Michigan
by Seth Keshel, MBA
Grand Rapids Presentation
Also available to download as a PDF.
Allegan County
The following PDF shows a map of which precincts in the county had the most abnormal results in 2020:
Berrien County
Genesee County
Ingham County
Jackson County
Kalamazoo County
Kent County
Livingstone County
Macomb County
The following chart shows an odd anomaly whereby instead of the votes for Democrats (blue) and Republicans (red) moving in opposite directions, they both went upward in 2020. Seth predicts that the Democrat numbers should have trended downward based on party registration numbers.
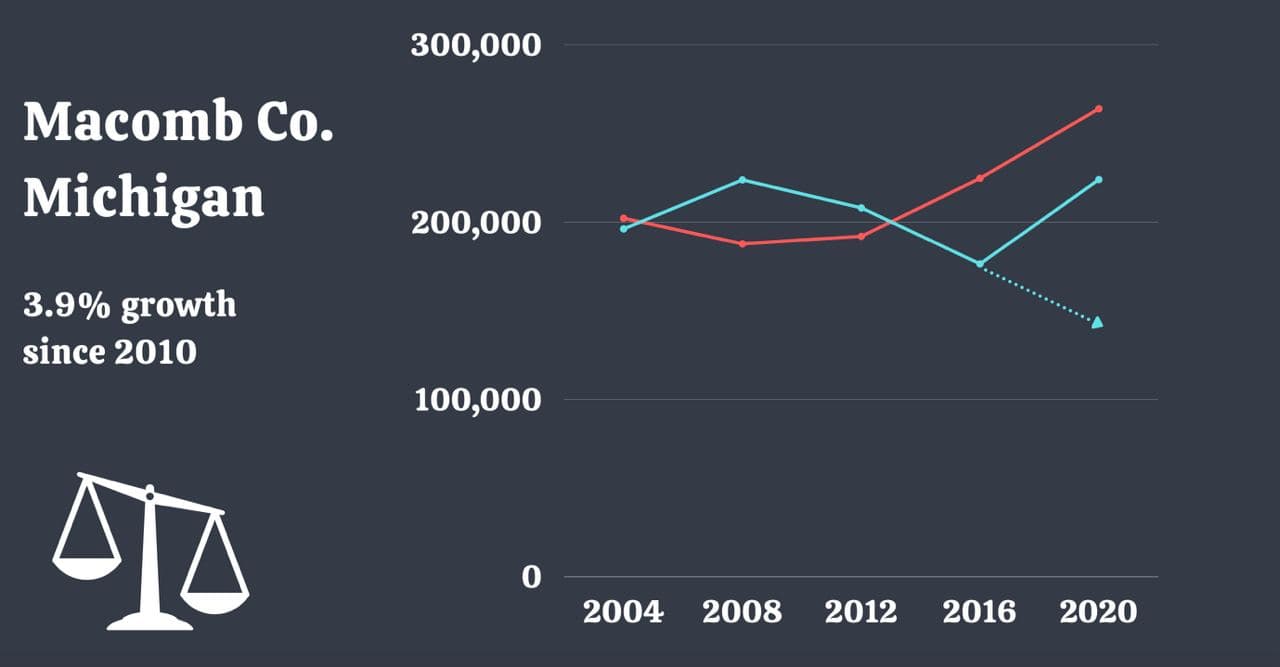
See also the canvassing findings in Macomb County which show significant issues with votes.
Muskegon County
Oakland County
Ottawa County
Washtenaw County
Wayne County
Events & Presentations
| Date | Presenter | Location | Link |
|---|---|---|---|
| Tue Oct 12, 2021 | Matt DePerno, Boris Epshteyn, Seth Keshel, Mike Lindell, Joe Oltmann, Jovan Pulitzer, and Brian Lupo |
Shelby Township, Michigan | More info |
Further Updates
Methodology
Seth Keshel’s estimates are based on the percentage of voters who are registered to each party (where it’s possible to obtain this information) compared to the actual votes for each party. He examined these party trends over the last two decades, as well as population growth, which brought to light the strange and statistically unlikely outliers and anomalies that occurred in 2020. We explain this process, step by step, with visual examples, in our guide How to Predict Election Results Using Registration Data, so that you can investigate the numbers for yourself.
This video from Telegram also explains some of Seth’s approach to analyzing precincts.
Raw Data
We aim to publish links to both the raw election data and voter registration data for Michigan so that citizens and researchers can analyze this information for themselves.
Other Reports
-
A team of scientists from Election-Integrity.info produced the report “2020 Presidential Election Startling Vote Spikes” which includes a section on Michigan
-
See also the main Michigan article for more
Seth’s Endorsement of Matthew DePerno for Attorney General
Election Audit Groups on Telegram
Further updates from Seth Keshel can be found on his Telegram Channel @ElectionHQ2024.
To join the grassroots efforts in pursuing election integrity and audits of the 2020 election in Michigan, you can join the following groups on Telegram:
- Attorney Matt DePerno
- Audit MI
- Election Integrity Force (Website)
- Michigan Audit Force
- Michigan Audit Force Discussion
- Michigan Audit
- Michigan Audit Chat
- Michigan One Six (helping Jan 6 political prisoners)
- Michigan One Six Discussion (helping Jan 6 political prisoners)
- Stand Up Michigan (Website)
For other states, see our Full List of Telegram Channels.
ElectionFraud20.org and Seth Keshel have no affiliation with nor any responsibility for these channels. Discern carefully, as some users and even admins of channels have shown obstruction to transparent audits of our elections.