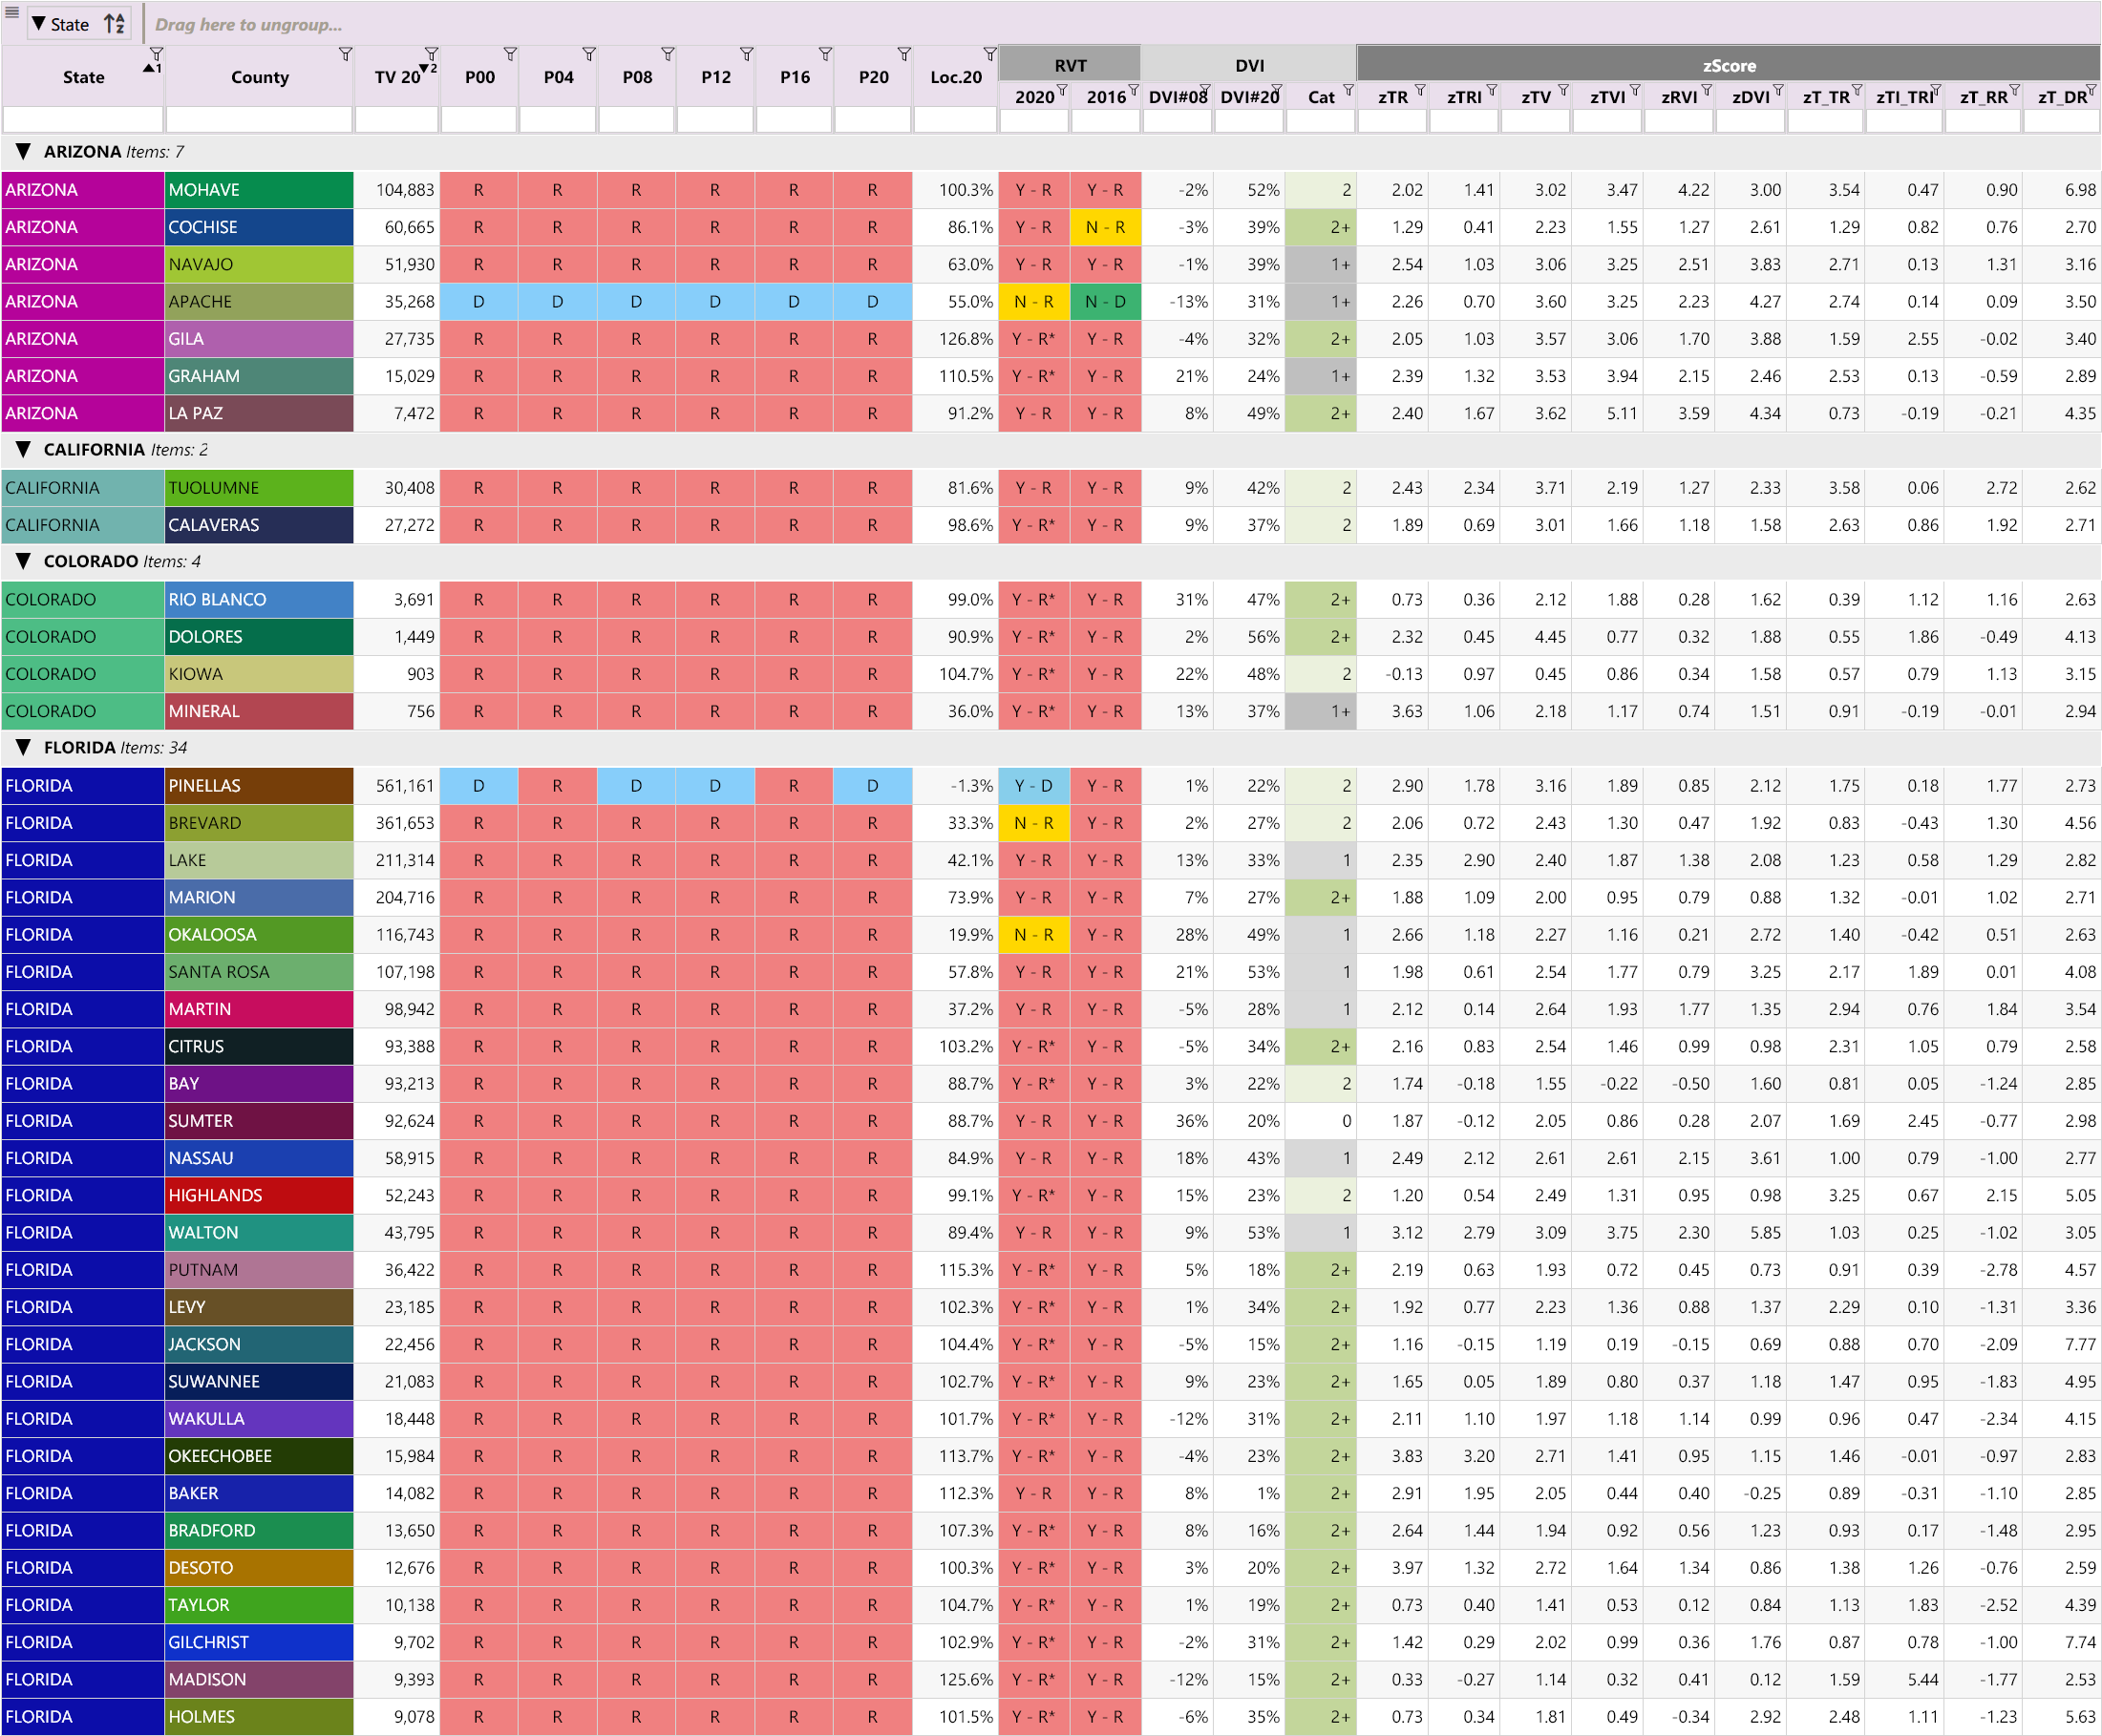
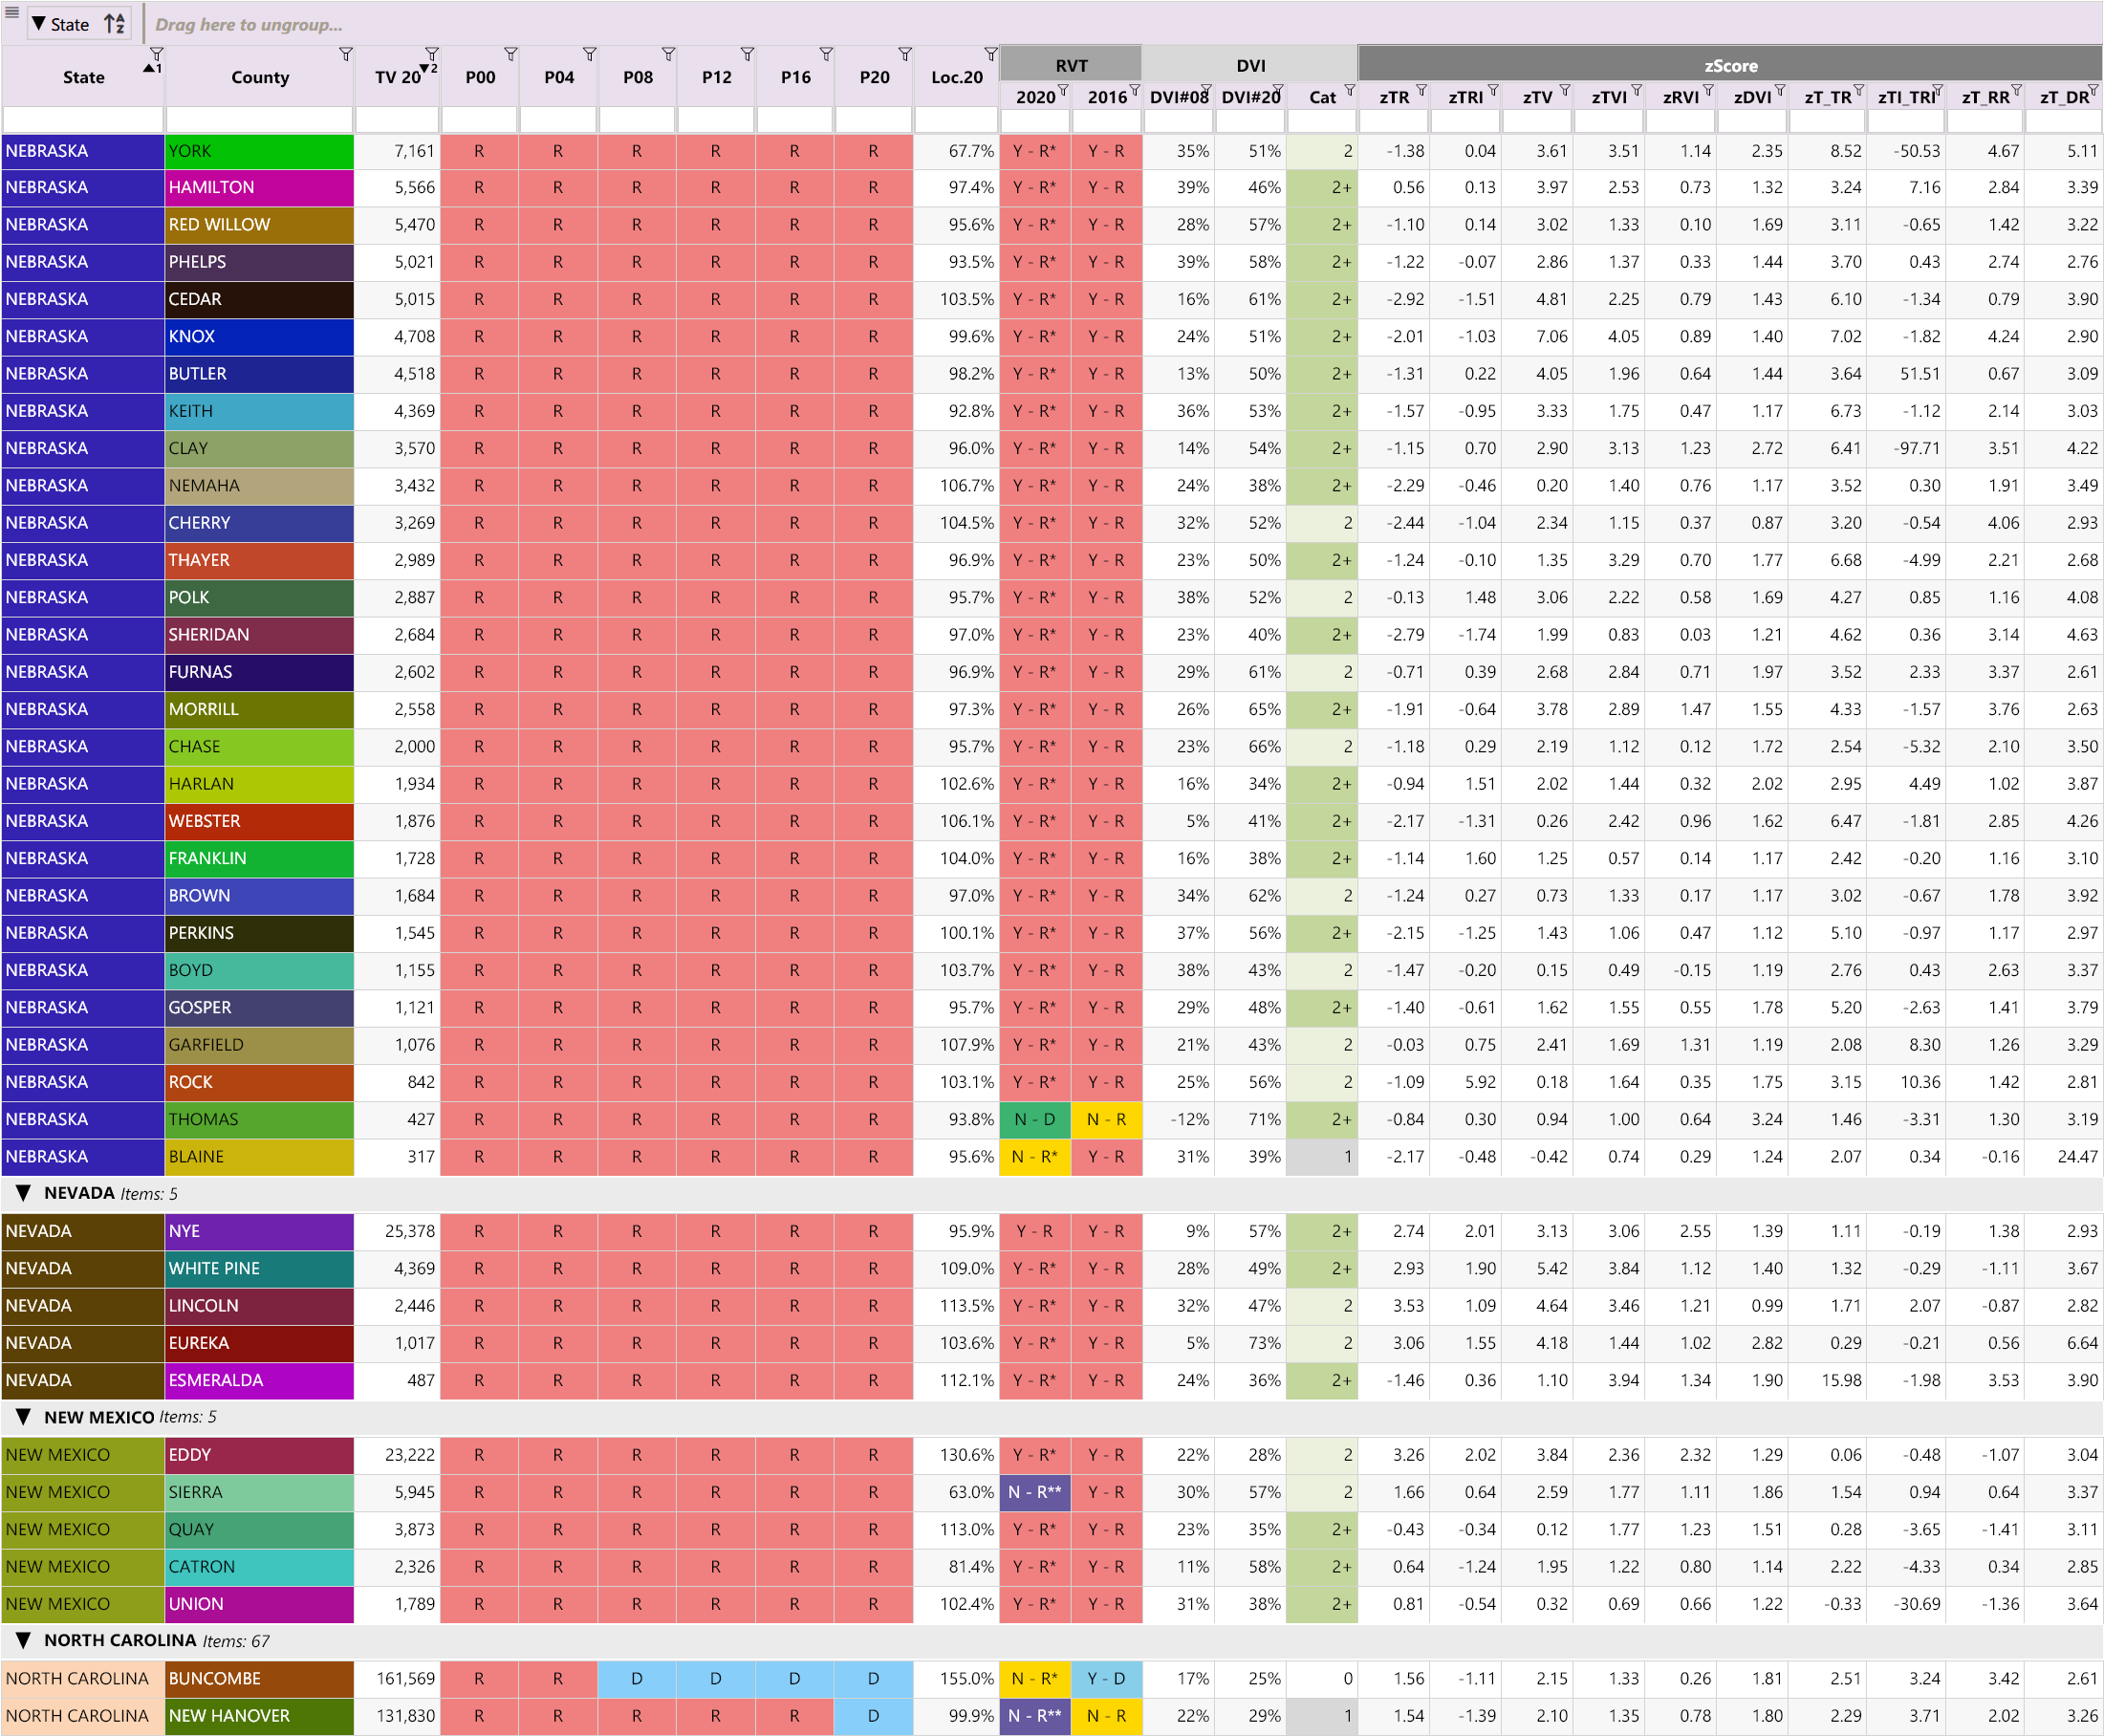
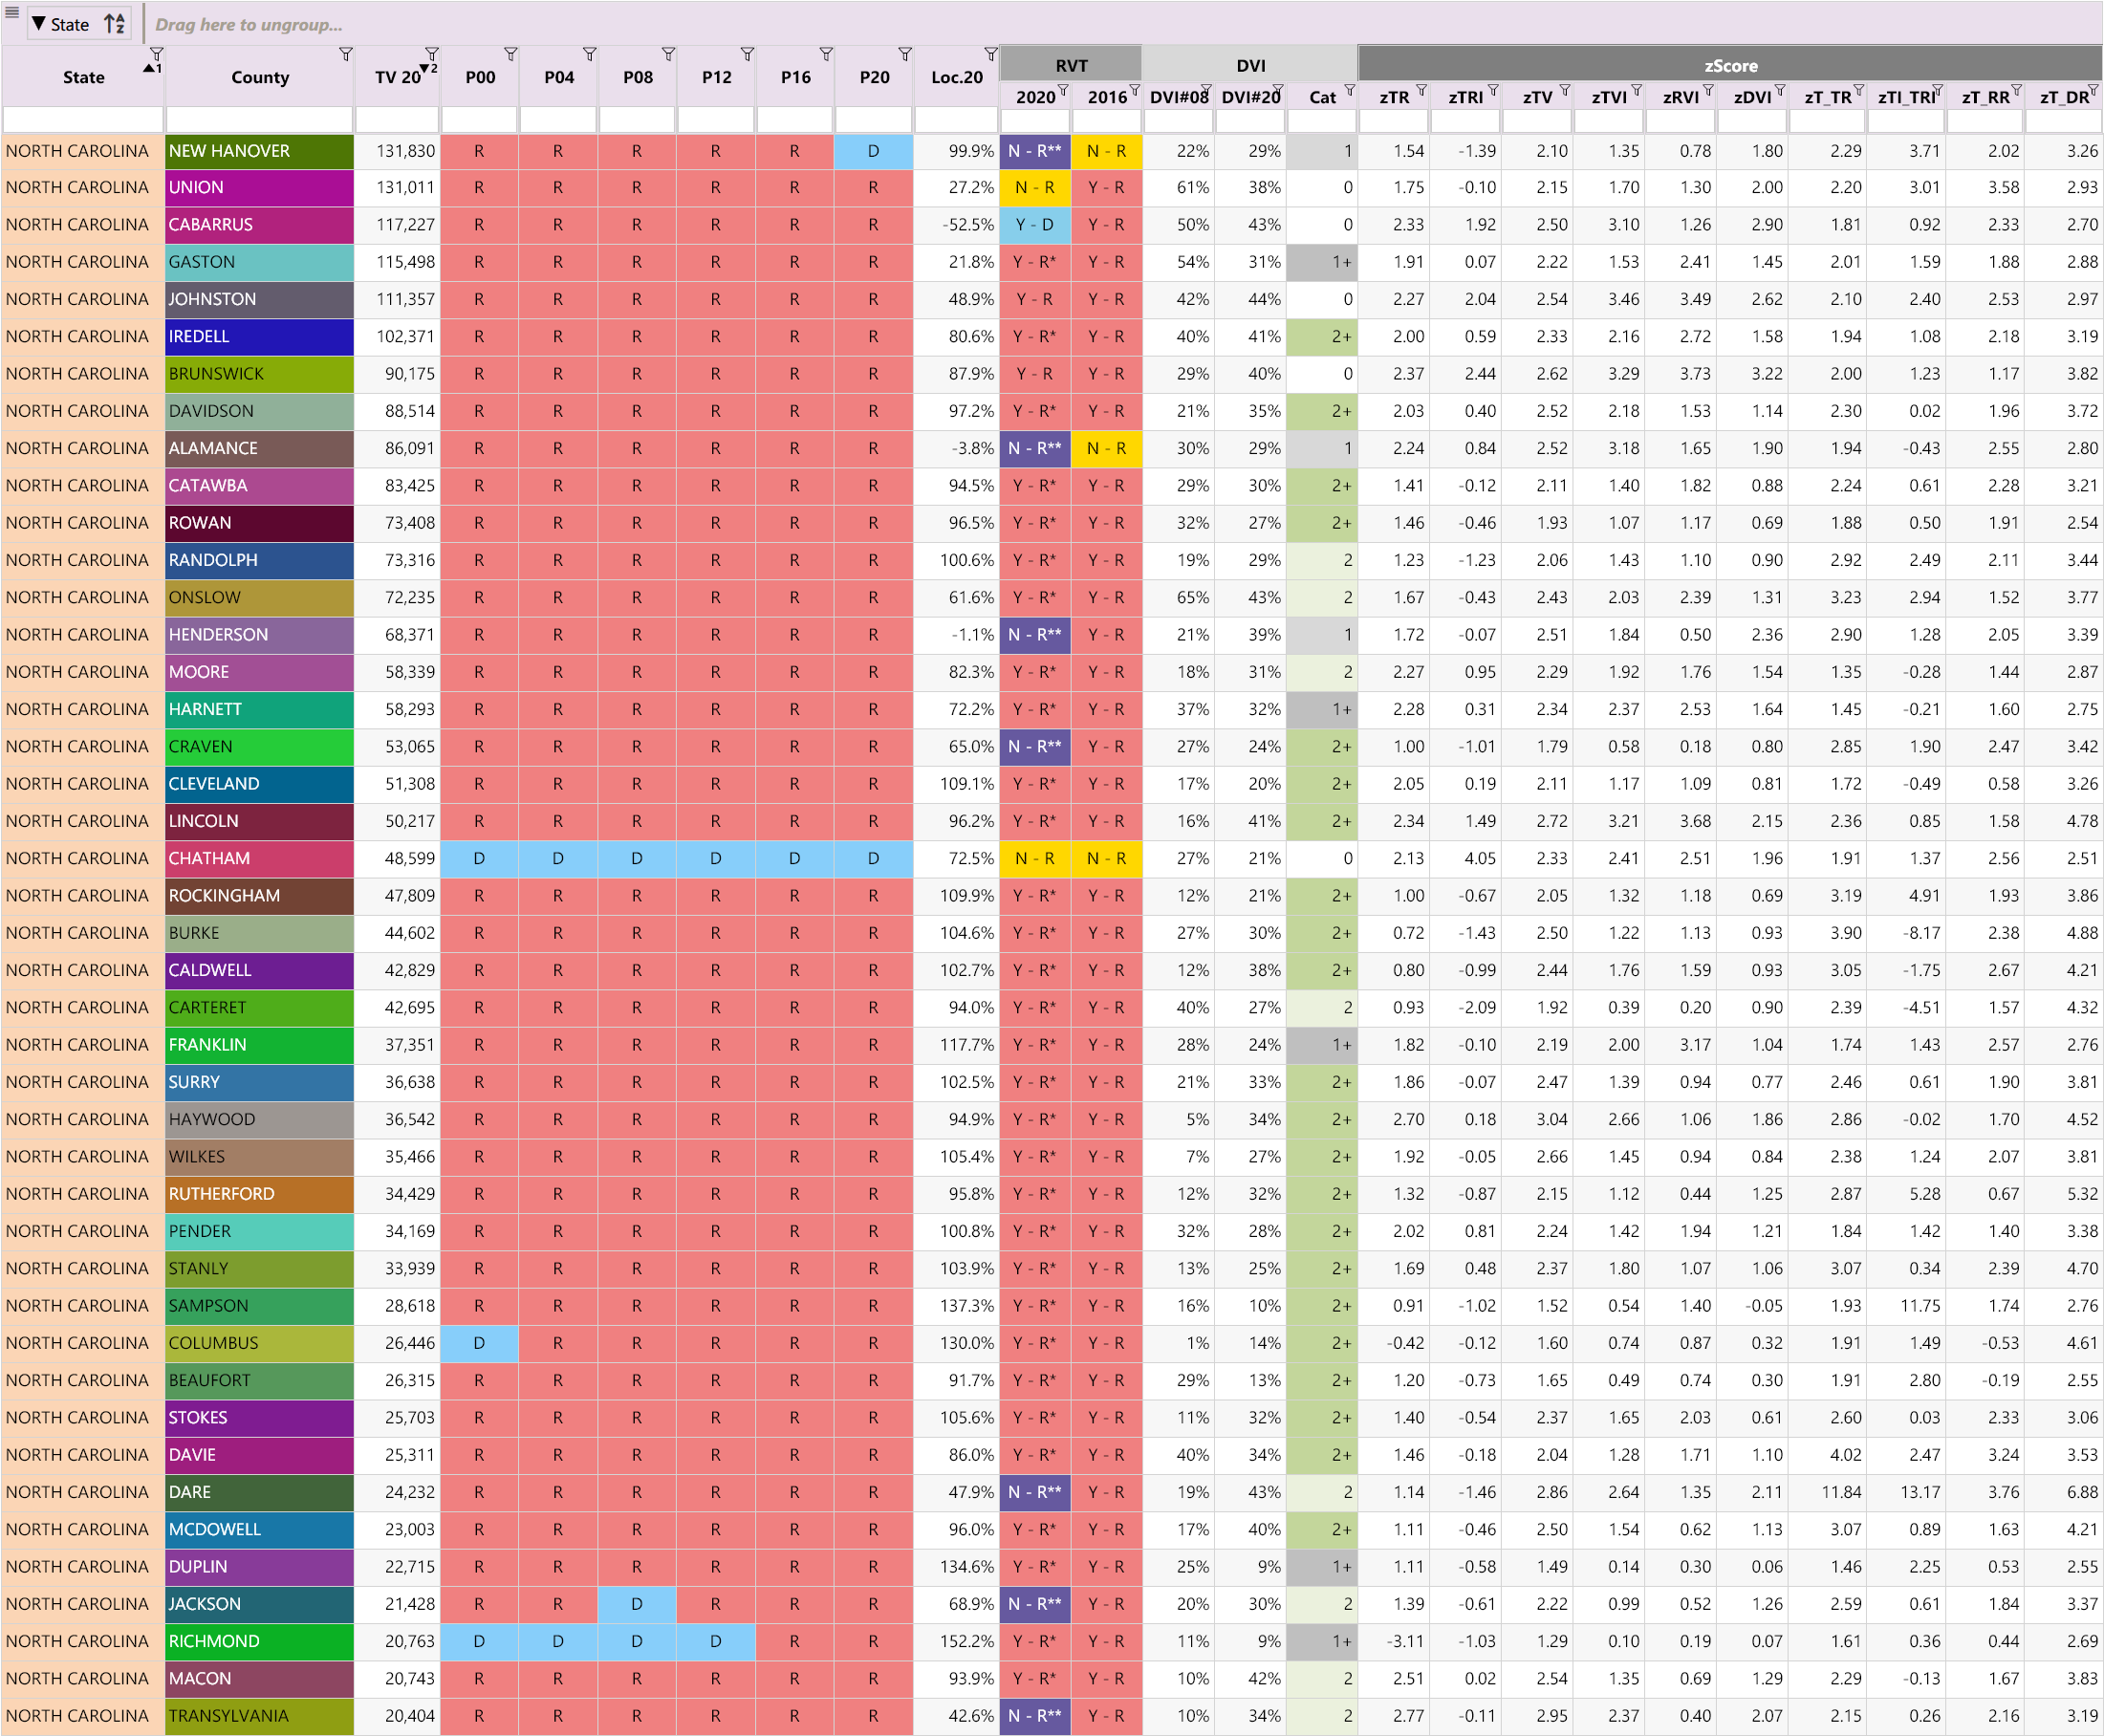
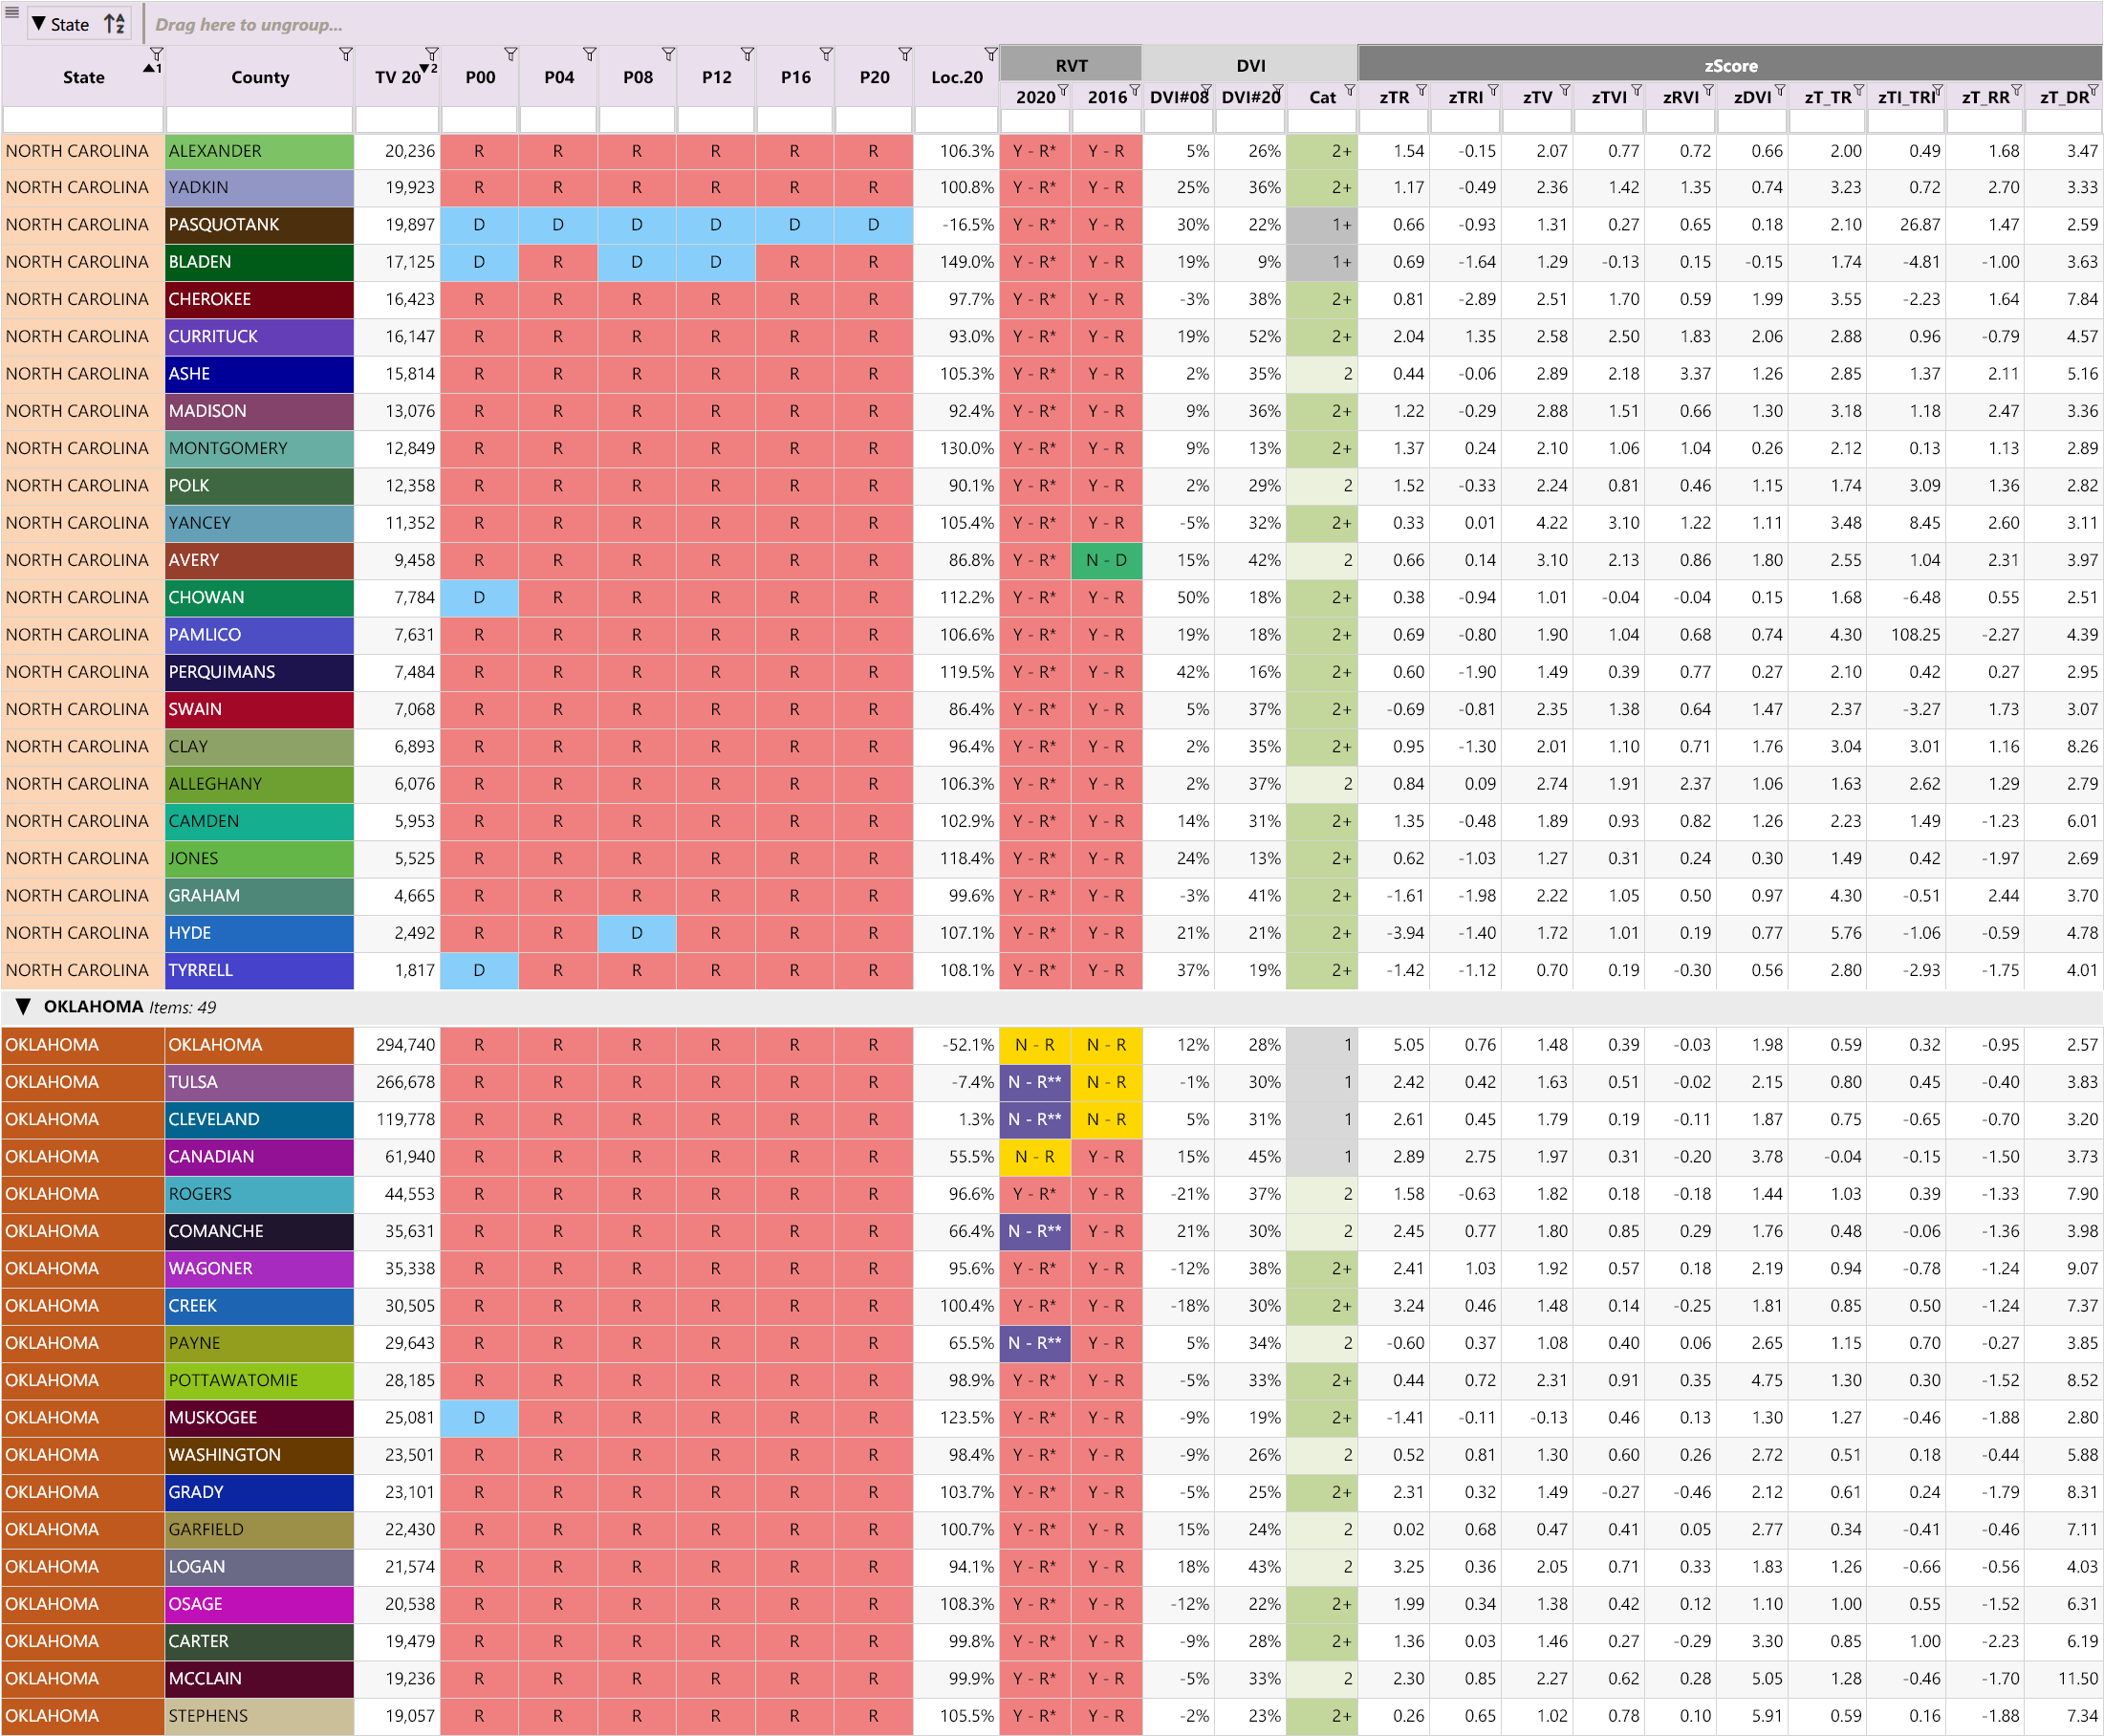
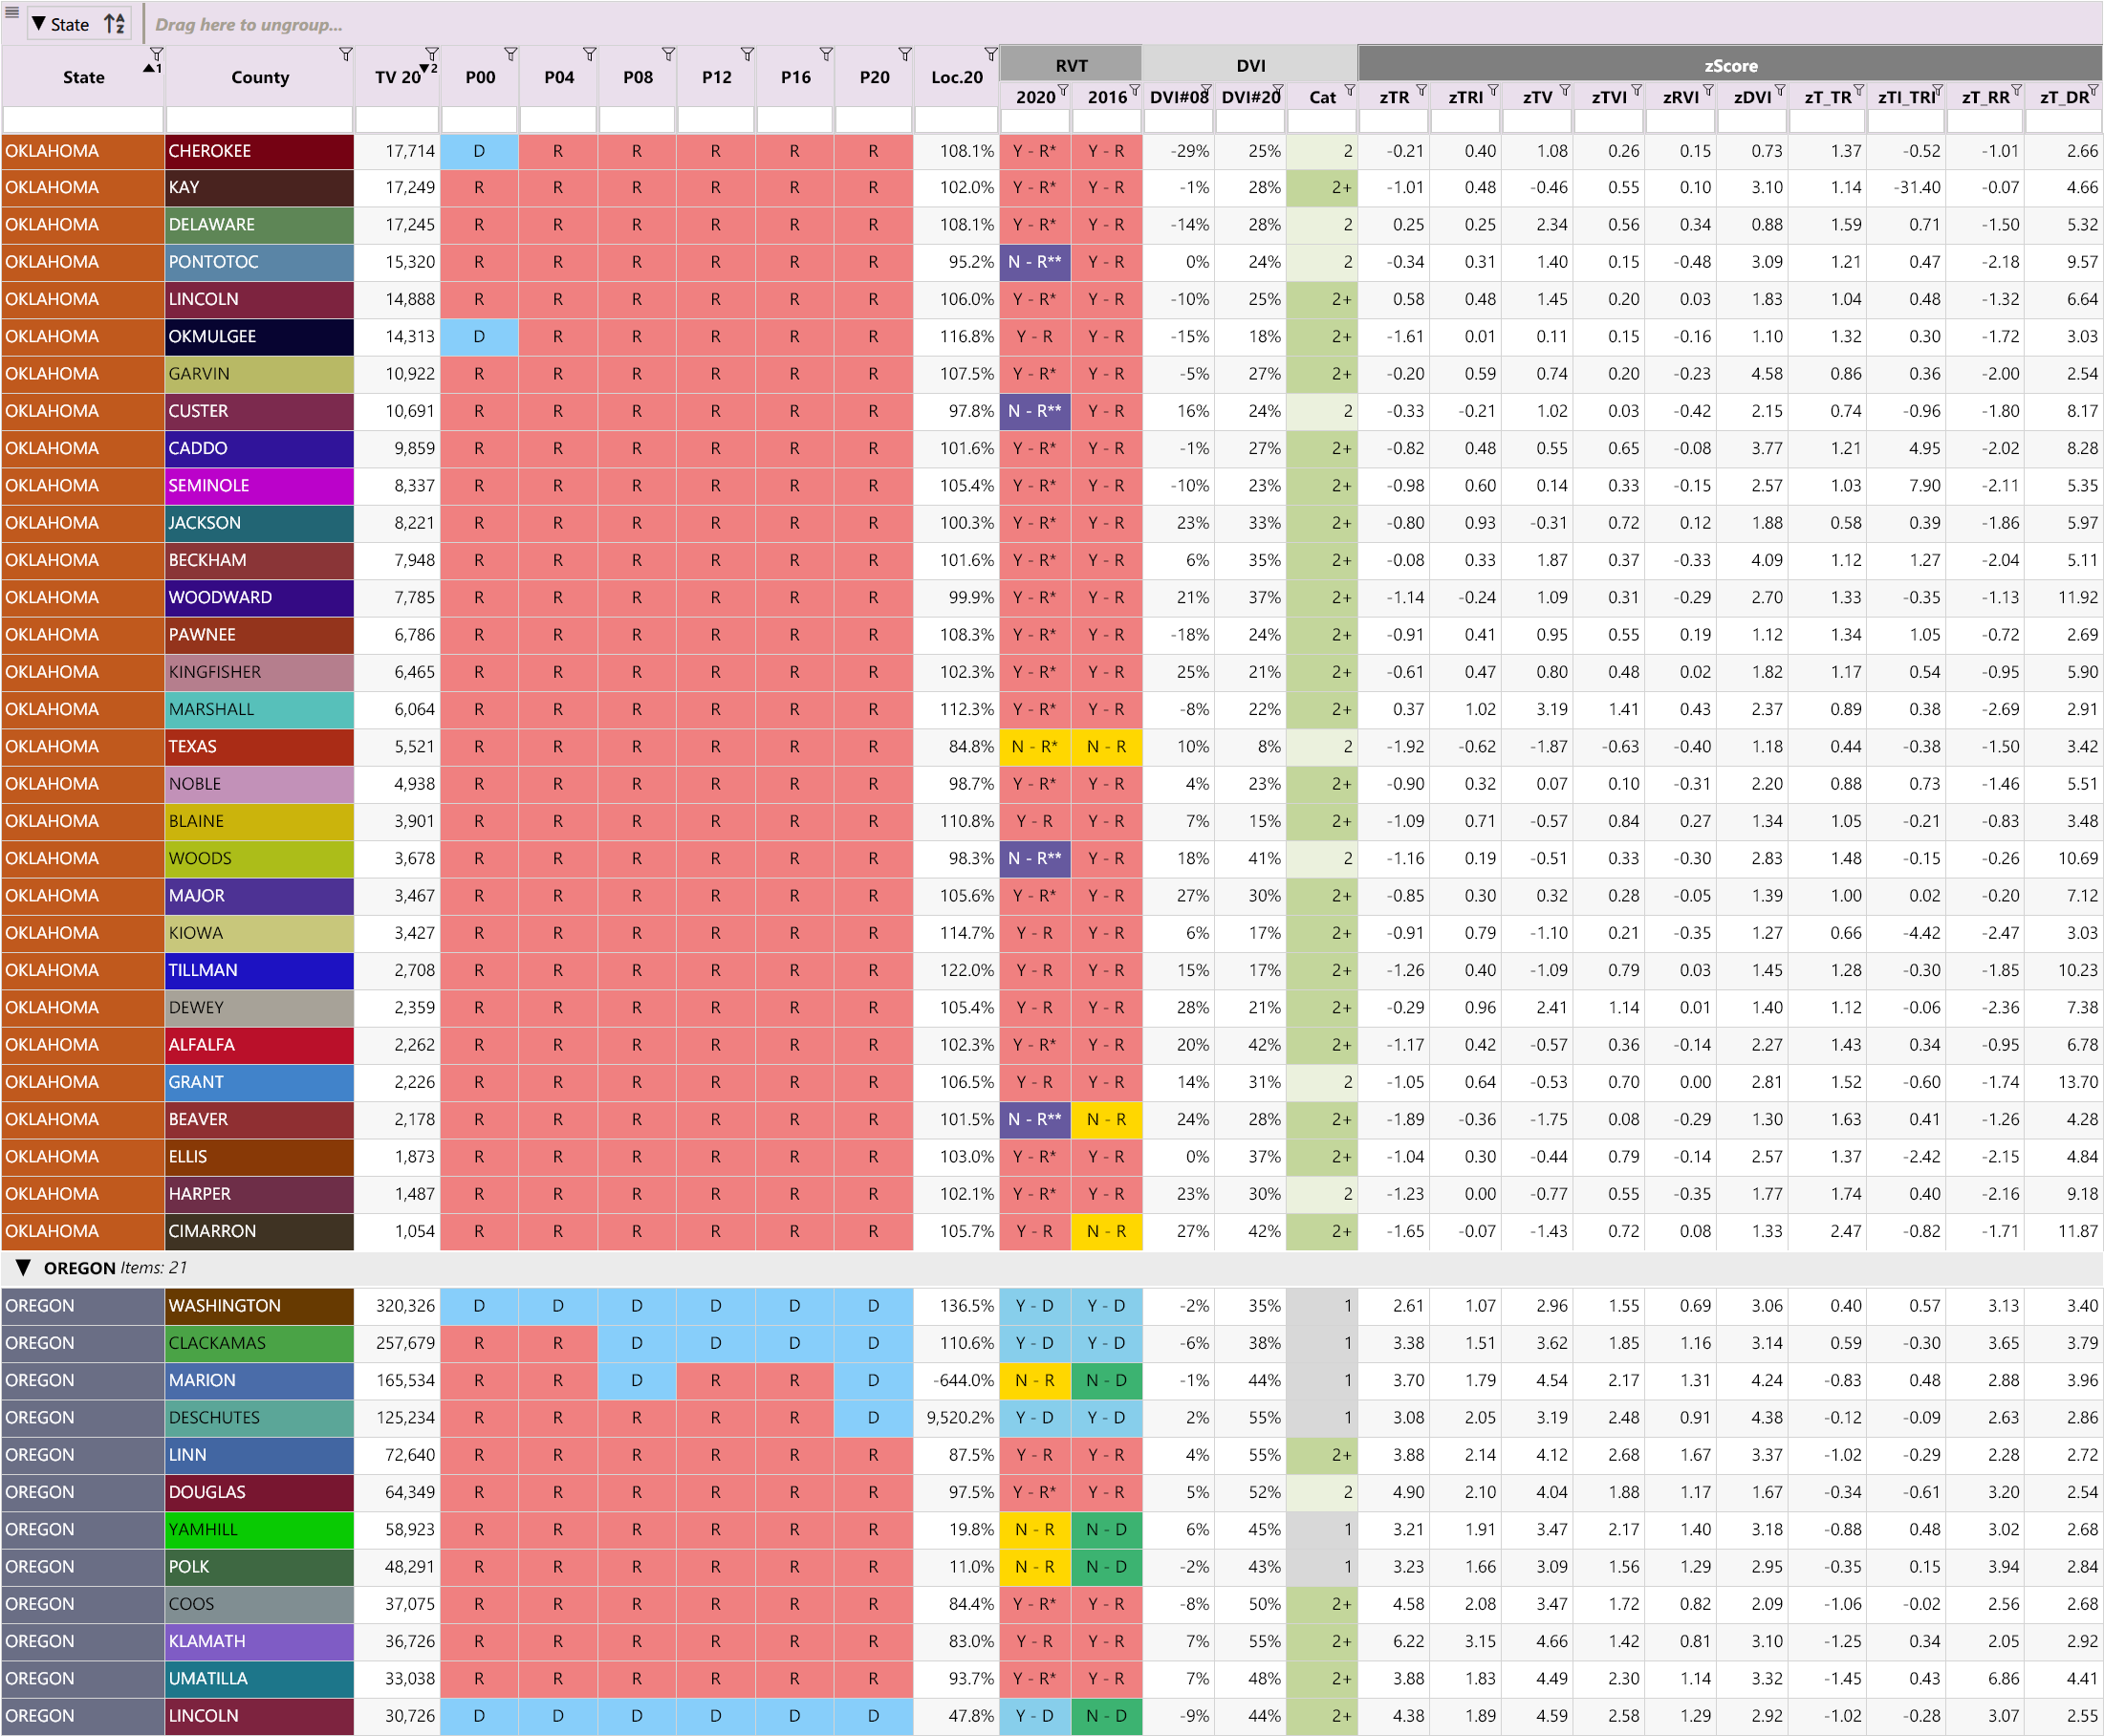
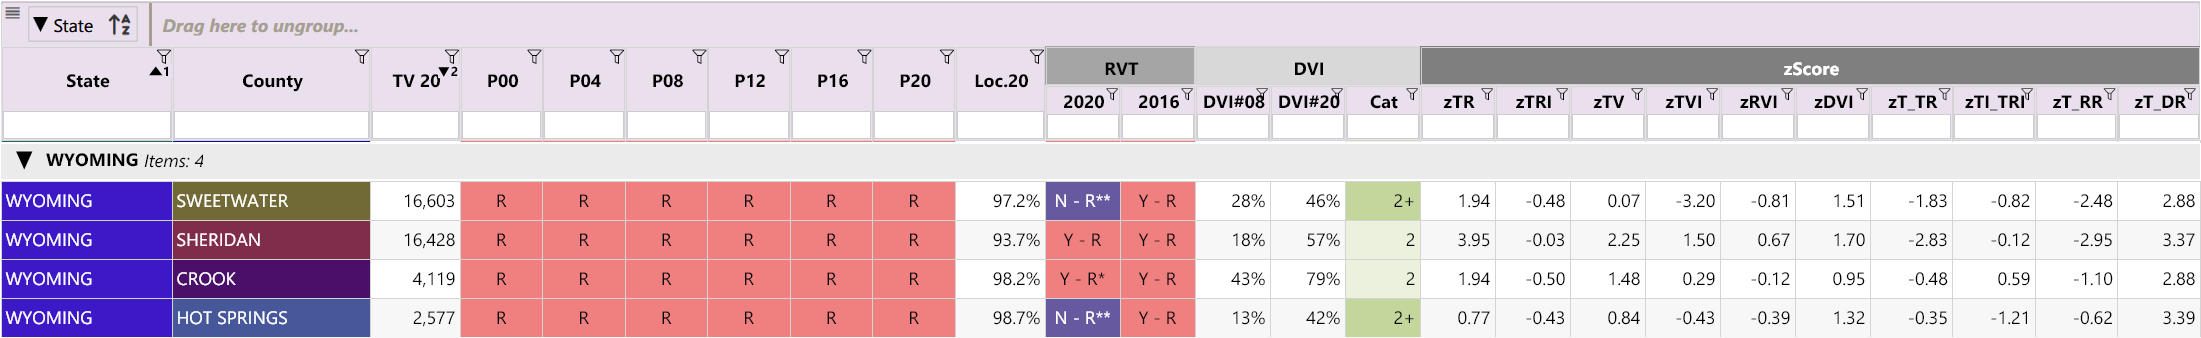
From our article on Unlikely z-Score values, here is the full list of counties (across the whole country) where, in 2020, the z-Score value for the Democrat Votes divided by Democrats Registrations (zTDR) is greater than 2.5.
💡 TIP:
All these counties are highly suspicious and would warrant further investigations.
| Values over 2.5 | Rare (typically only 1 in 100) | 🧐 |
| Values over 3 | Extremely unlikely | 😲 |
| Values over 4 | “Super extremely” unlikely | 😱 |
In other words, values over 4 should be super extremely rare, yet there are 116 counties across 14 states with a zTDR greater than 4!
- Louisiana has 12
- Pennsylvania has 13
- Florida has 15
- North Carolina has 18
- Oklahoma has 34 😳


Other Articles In This Series
| Overview | Diving deeper into the unusual trends and statistics discovered in the 2020 election. |
| Part 1 | A look at the surprising failure of the bellwether counties in 2020, and what that tells us about the Presidential election outcome. |
| Part 2 | The data shows the Democrats are winning less and less counties at each election, but are winning more and more of the largest counties. How is this possible? |
| Part 3 | Voter turnout rates shot up dramatically in many states in 2020. We look at the voting rates since 2000 to find out which states set a new record. |
| Part 4 | Learn how to "normalize" a county's winning margin to identify abnormalities. What does this reveal about the 2020 election? |
| Part 5 | Learn how to use the party registration numbers for each county to predict the election results for a state and assess the likely validity of the results. This is a guide on the method Seth Keshel uses for his predictions and county heat maps, allowing you to dig into the trends of your own county and uncover anomalies. |
| Part 6 | We build on some of the previous techniques to scan 3,111 American counties, identifying those whose shift in vote totals moves unexpectedly against the shift in party registrations. |
| Part 7 | We compare the Democrat vote totals with previous elections which reveal some very large increases in unlikely places. |
| Part 8 | We compare key parameters in the 2020 results against the previous five elections using the z-score, and find hundreds of counties breaking statistical norms. |
| Part 9 | Interesting statistical findings on how the Presidential race results compared to the other races in the same election. |
| Part 10 |
Voter Roll Analysis
Coming soon.
|
| Part 11 |
The Art of the Steal
Coming soon.
|
Follow us on Telegram to be notified when we release the remaining articles.