See also the main article on Utah, for documented election integrity issues and further reports.
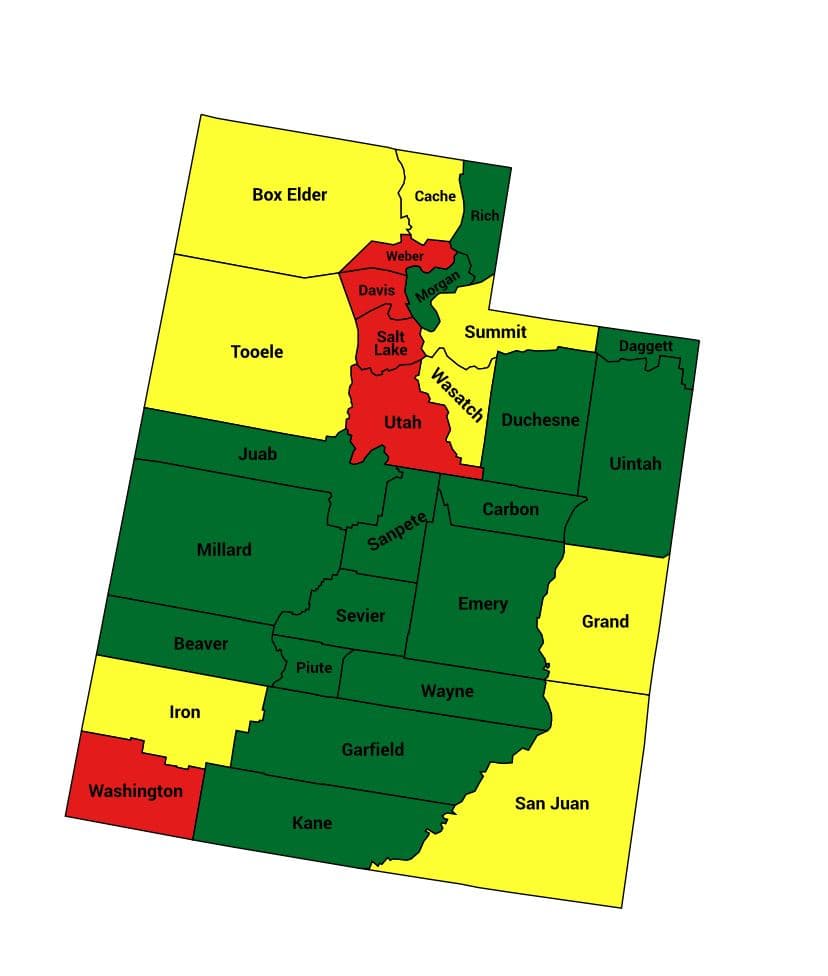
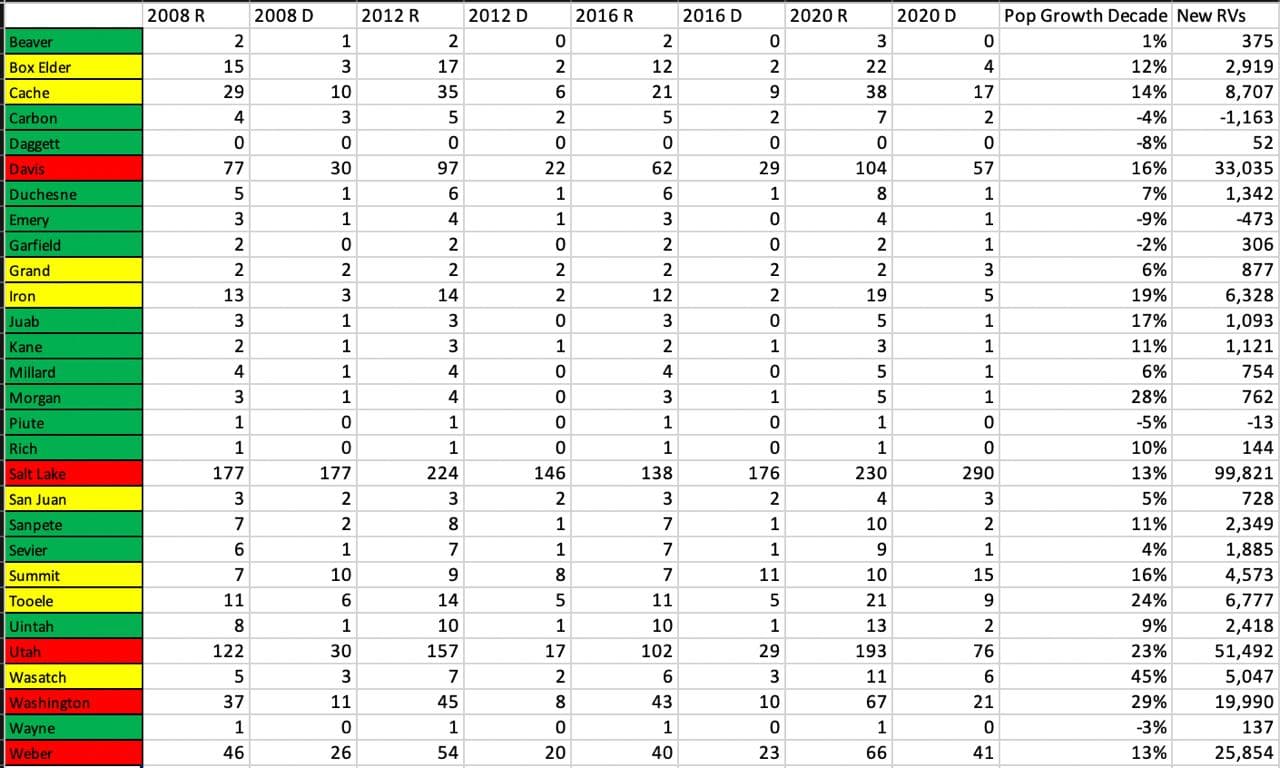
Former US military intelligence officer and statistical analyst Seth Keshel analyzed the trends of voter registrations versus actual votes. The following report indicates which counties’ vote counts align with the trend in voter registrations and which have small or large divergences. Each county is flagged as red, yellow, or green, based on whether the 2020 vote totals aligned with the expected trends (as past decades demonstrate they typically do), or if they diverged in statistically unlikely ways.

| Trump votes | Biden votes | Other votes | |
|---|---|---|---|
| Officially reported results | 865140 (58.13%) | 560282 (37.65%) | 62799 (4.22%) |
| Estimate of potential fraud | 131000 (8.8%) | ||
| Estimate of actual result
(with fraud removed) |
865140 (63.7%) | 429282 (31.6%) | 62799 (4.6%) |
Utah is one of hardest to gauge, thanks to poor record keeping (Utah registers by party, but not available across counties), the presence of a serious 3rd party challenger in 2016, and Romney’s home state skew. Most accurate comps go back to 2008.
I think Utah was a target by central planners – Biden has 45k more than Trump ’16; perhaps they anticipated the same 3rd party behavior. Trump is 125k past Romney ’12, but Biden’s gains are 250k from Clinton, when previous high gain was Obama ’08 with 87k. Nearly all third party throwaways came from Republicans in 2016.
| Red | Obviously Ugly | (5 counties) |
| Yellow | Suspect/Likely Fraud | (8 counties) |
| Green | Clean | (16 counties) |
Estimates for excess votes based on population growth/trends:
| Salt Lake | 50k |
| Utah | 30k |
| Davis | 20k |
| Weber | 9k |
| Washington | 7k |
I estimate 131k excess votes. If accurate, and counting ONLY excess Biden vote growth, Trump should have won this state about 63.7% to 31.6%, or by 32.1%. Biden’s gain in Salt Lake City was a massive 114k, when the previous largest gain was 31k by Obama in 2008. This should be looked into.
Source: https://t.me/CaptainKMapsandStats/25
Historical Growth
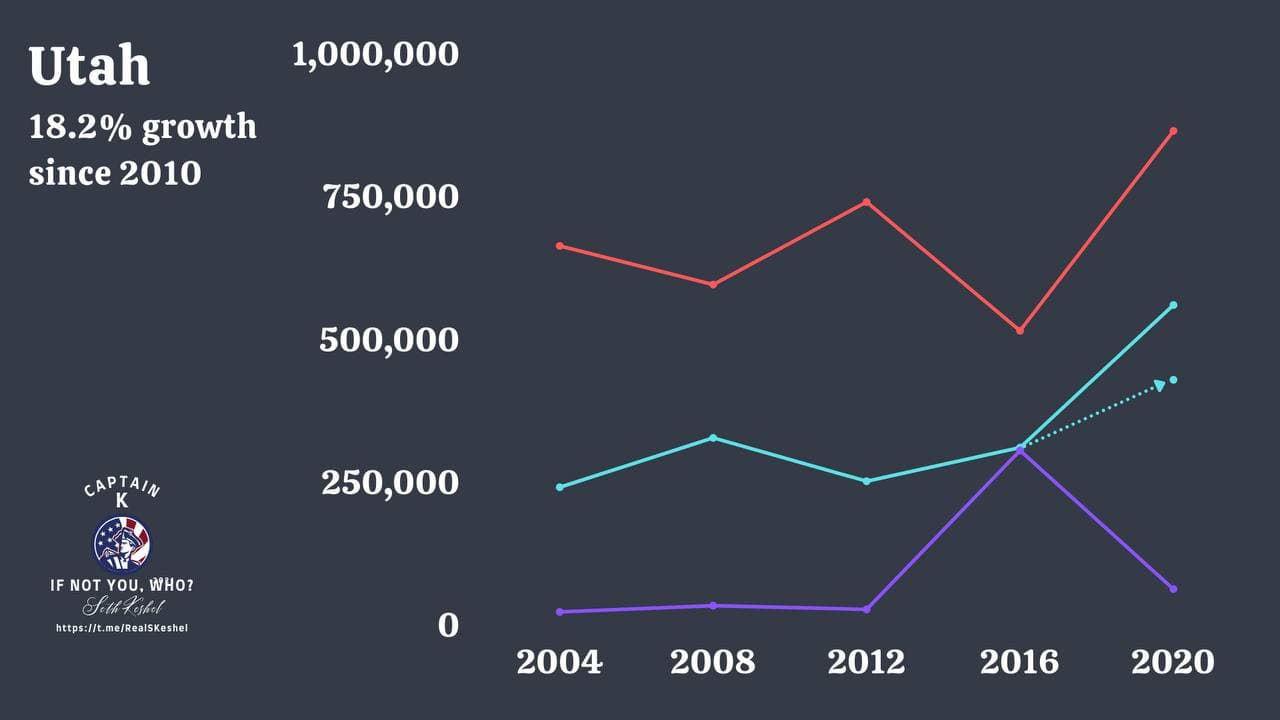
These are votes by party per election. Red Republican, Blue Democrat, Purple Other.
-
Look at how unpopular Trump was in 2020 compared to Romney 2012 (sarcasm).
-
Now look at that massive Democrat increase after they were stuck three elections in a row. It likely should have been much less.
-
The large jump in 2016’s third-party vote was likely 85% from Republicans who didn’t want to vote for Trump.
Top 100 Worst Counties
Seth has listed Utah’s Salt Lake and Utah counties as being among the Nation’s Top 100 Worst Counties in terms of abnormal trends during the 2020 election.
Unexpected Surge in Mail-In Ballots
Events
-
Seth presented in Farmington, Utah on Sept 2, 2021. See his Telegram post and this follow-up video.
Methodology
Seth Keshel’s estimates are based on the percentage of voters who are registered to each party (where it’s possible to obtain this information) compared to the actual votes for each party. He examined these party trends over the last two decades, as well as population growth, which brought to light the strange and statistically unlikely outliers and anomalies that occurred in 2020. We explain this process, step by step, with visual examples, in our guide How to Predict Election Results Using Registration Data, so that you can investigate the numbers for yourself.
This video from Telegram also explains some of Seth’s approach to analyzing precincts.
Raw Data
We aim to publish links to both the raw election data and voter registration data for Utah so that citizens and researchers can analyze this information for themselves.
Election Audit Groups on Telegram
Further updates from Seth Keshel can be found on his Telegram Channel @ElectionHQ2024.
To join the grassroots efforts in pursuing election integrity and audits of the 2020 election in Utah, you can join the following groups on Telegram:
For other states, see our Full List of Telegram Channels.
ElectionFraud20.org and Seth Keshel have no affiliation with nor any responsibility for these channels. Discern carefully, as some users and even admins of channels have shown obstruction to transparent audits of our elections.