See also the main article on New York, for documented election integrity issues and further reports.
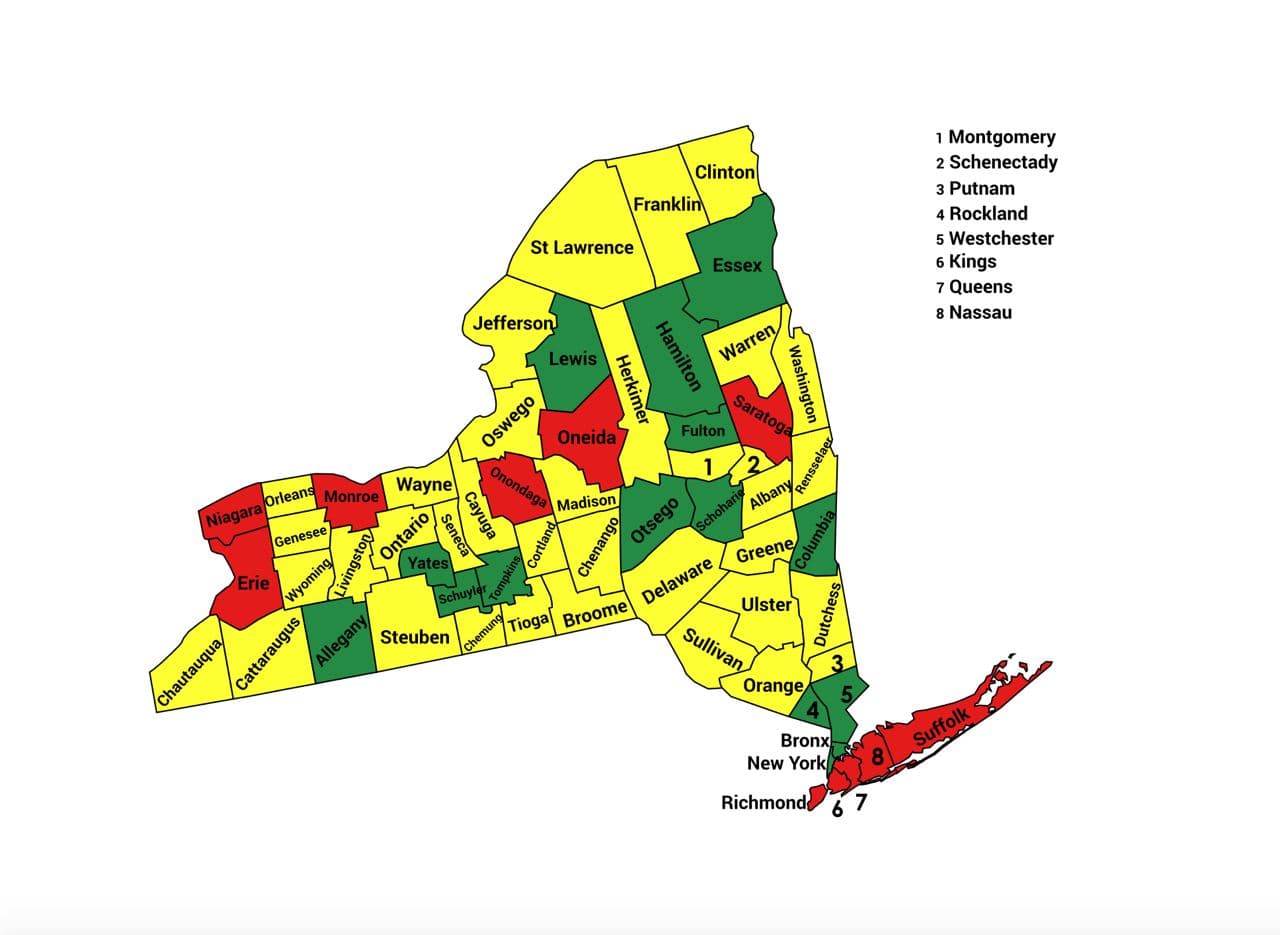
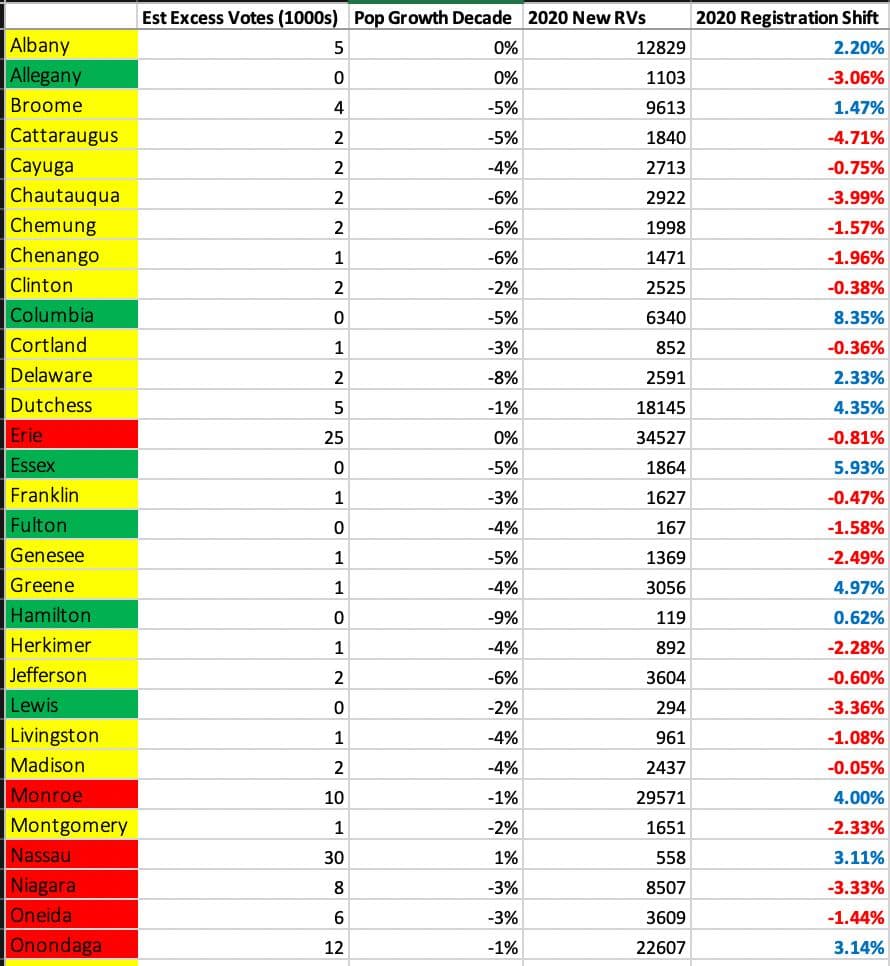
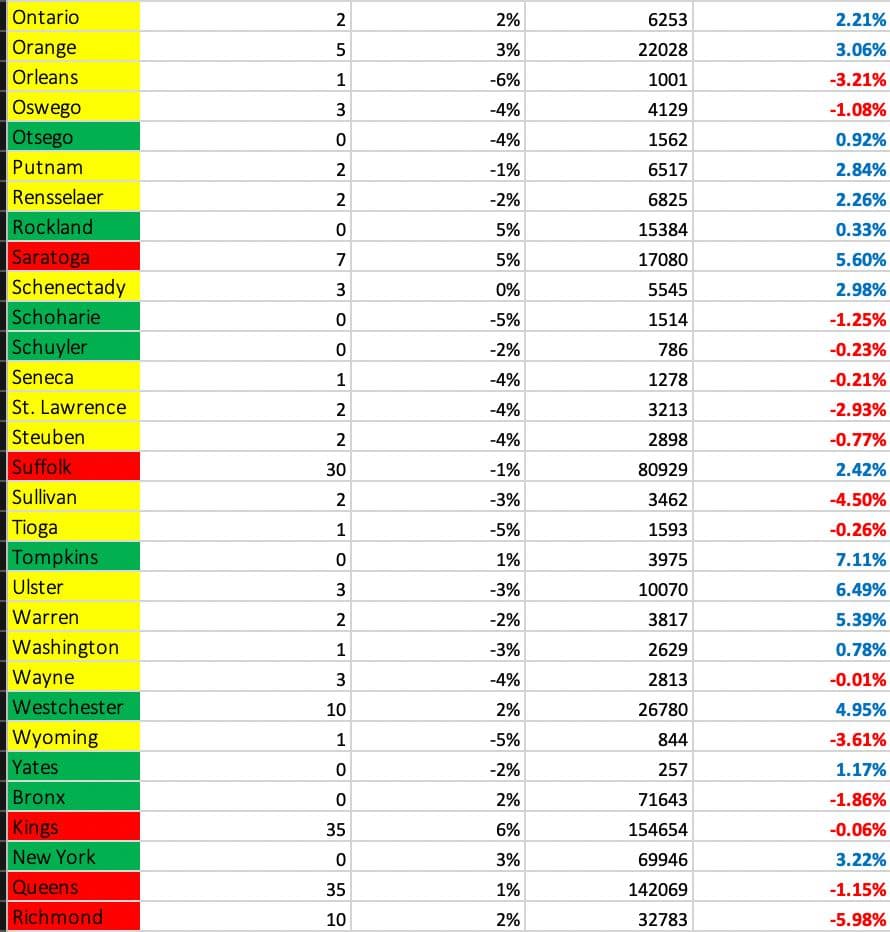
Former US military intelligence officer and statistical analyst Seth Keshel analyzed the trends of voter registrations versus actual votes. The following report indicates which counties’ vote counts align with the trend in voter registrations and which have small or large divergences. Each county is flagged as red, yellow, or green, based on whether the 2020 vote totals aligned with the expected trends (as past decades demonstrate they typically do), or if they diverged in statistically unlikely ways.

| Trump votes | Biden votes | Other votes | |
|---|---|---|---|
| Officially reported results | 3251997 (37.7%) | 5244886 (60.9%) | 120572 (1.4%) |
| Estimate of potential fraud | 292000 (3.4%) | ||
| Estimate of actual result
(with fraud removed) |
3251997 (39.1%) | 4952886 (59.5%) | 120572 (1.4%) |
New York drifted 1.5% left in voter registrations, and another 0.7% left in vote, but it appears Biden is 292k votes heavy just based on trends. It is clear Trump did well with registered Democrats in New York with 432k vote gain. Clinton improved just 70k over Obama; Biden is strangely 689k over Clinton and 440k over Obama in 2008.
Trump’s biggest improvements were in New York City, with 4 of 5 trending Republican (Richmond would have if clean). Trump won NEW TWO PARTY votes in New York City 180k to 146k. It appears New York did not account for Trump gains in New York City so Bronx at 0.1% and Manhattan at 4% Democrat increase paints a picture of “true city enthusiasm” for Biden throughout the US.
Manhattan, Bronx, Queens are in green DUE TO TREND. My analysis doesn’t detect what is baked in for decades.
If Biden is 292k heavy, an accurate margin for him would be 59.5% to 39.0%.
Best audit targets:
Richmond, Suffolk, Nassau, Saratoga, Oneida, Onondaga
Source: https://t.me/CaptainKMapsandStats/98
Top 100 Worst Counties
Seth has listed New York’s Erie, Nassau, and Suffolk counties as being among the Nation’s Top 100 Worst Counties in terms of abnormal trends during the 2020 election.
Further Updates
Methodology
Seth Keshel’s estimates are based on the percentage of voters who are registered to each party (where it’s possible to obtain this information) compared to the actual votes for each party. He examined these party trends over the last two decades, as well as population growth, which brought to light the strange and statistically unlikely outliers and anomalies that occurred in 2020. We explain this process, step by step, with visual examples, in our guide How to Predict Election Results Using Registration Data, so that you can investigate the numbers for yourself.
This video from Telegram also explains some of Seth’s approach to analyzing precincts.
Raw Data
We aim to publish links to both the raw election data and voter registration data for New York so that citizens and researchers can analyze this information for themselves.
Other Reports
A team of scientists from Election-Integrity.info produced the following reports:
-
“2020 Presidential Election Contrast Analysis” which lists New York as the state with the 4th highest number of unexpected Biden votes, despite a decrease in population
-
“Statistical Voting Analysis of the 2020 NY-22 Congressional Contest”
Election Audit Groups on Telegram
Further updates from Seth Keshel can be found on his Telegram Channel @ElectionHQ2024.
To join the grassroots efforts in pursuing election integrity and audits of the 2020 election in New York, you can join the following groups on Telegram:
- New York Audit Force
- New York Audit Force Discussion
- NY Audit Chats
- NY Citizens Audit Chat
- NY Citizens Audit Chat (Website)
For other states, see our Full List of Telegram Channels.
ElectionFraud20.org and Seth Keshel have no affiliation with nor any responsibility for these channels. Discern carefully, as some users and even admins of channels have shown obstruction to transparent audits of our elections.