See also the main article on New Jersey, for documented election integrity issues and further reports.
Former US military intelligence officer and statistical analyst Seth Keshel analyzed the trends of voter registrations versus actual votes. The following report indicates which counties’ vote counts align with the trend in voter registrations and which have small or large divergences. Each county is flagged as red, yellow, or green, based on whether the 2020 vote totals aligned with the expected trends (as past decades demonstrate they typically do), or if they diverged in statistically unlikely ways.

| Trump votes | Biden votes | Other votes | |
|---|---|---|---|
| Officially reported results | 1883274 (41.4%) | 2608335 (57.3%) | 59177 (1.3%) |
| Estimate of potential fraud | 327000 (7.2%) | ||
| Estimate of actual result
(with fraud removed) |
1883274 (44.6%) | 2281335 (54.0%) | 59177 (1.4%) |
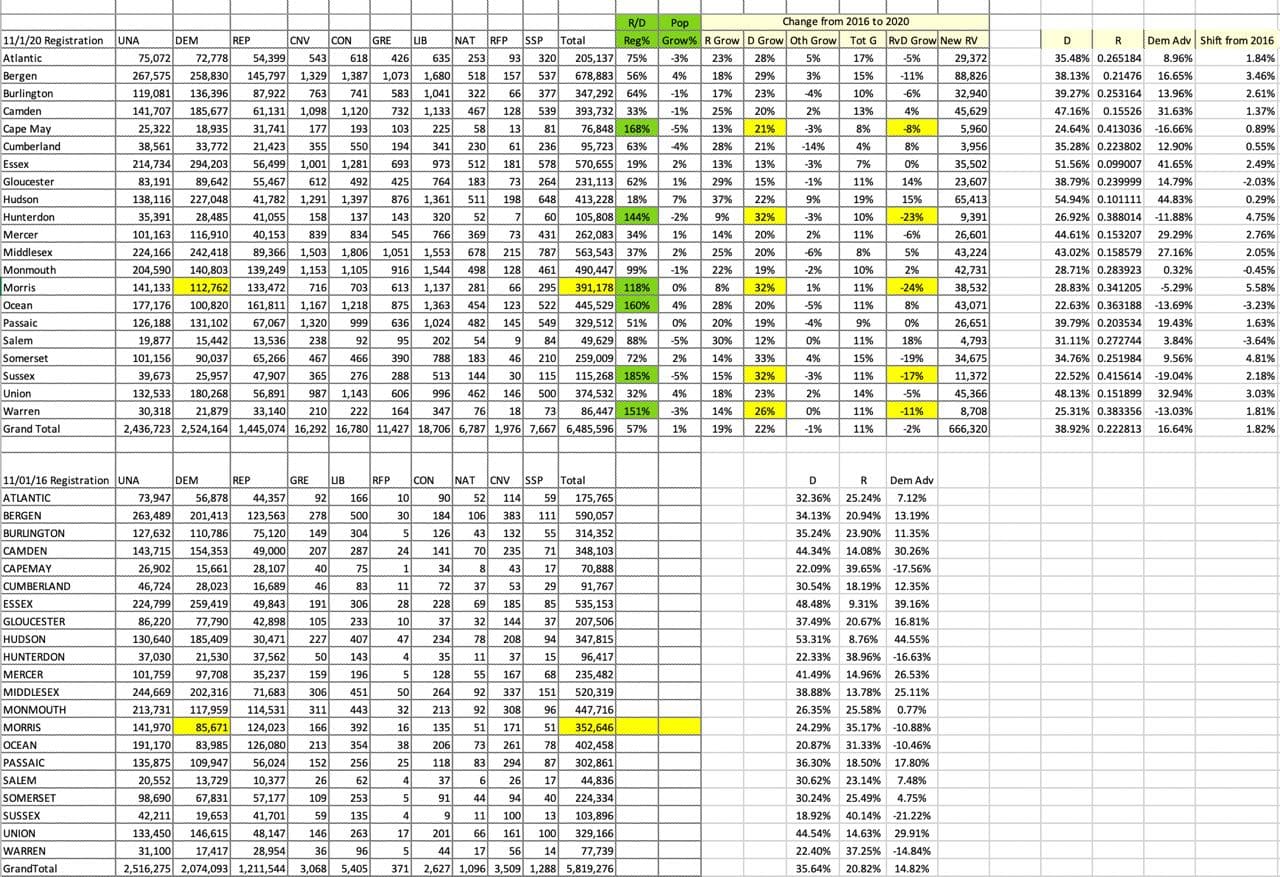
Ever so slightly, New Jersey has been trending away from Democrats and responded big-time in vote increase (281k) for Trump in 2020. Very conservative estimate (I always go light) is 327k excess Biden votes in New Jersey.
Biden’s gain in New Jersey from 2016 is 460k, simply not possible with the Trump surge and declining population. Voter registration trends suggest New Jersey moves left, but the ACTUAL VOTING BEHAVIOR from 2012, 2016, and now 2020 suggests the registration rolls are packed with ‘phantom’ voters registered as Democrat to support outcomes.
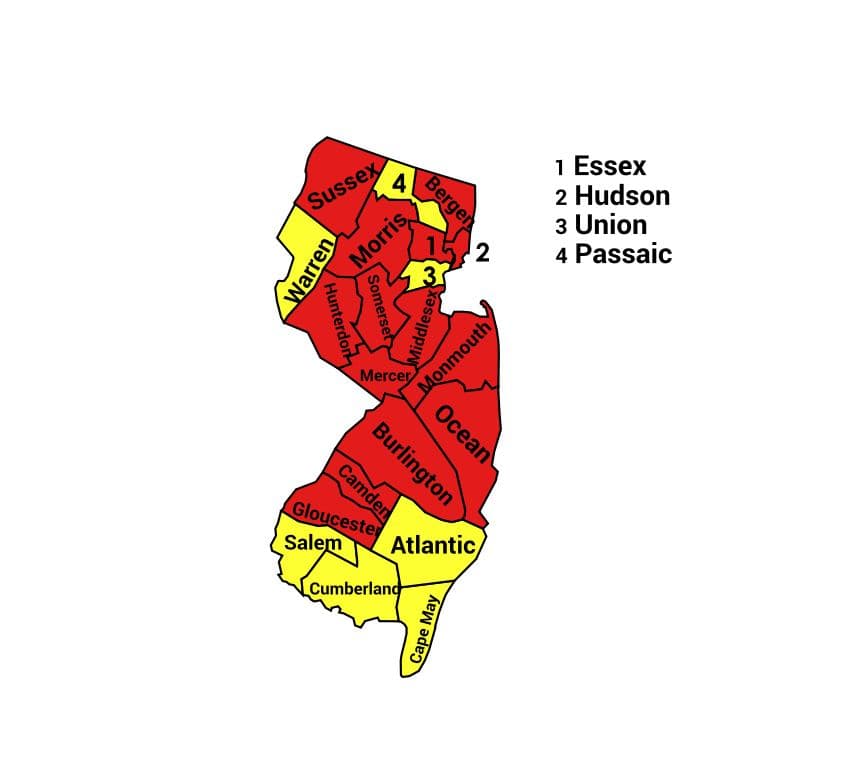
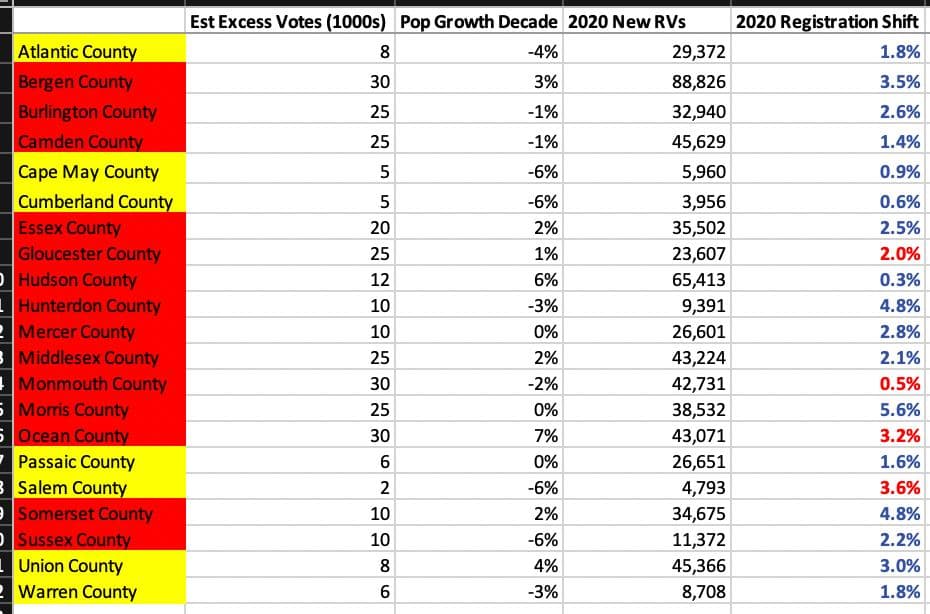
Worst counties:
Ocean, Monmouth, Bergen (30k)
Burlington, Camden, Gloucester, Morris (25k)
Essex (20k)
If Biden is 327k heavy, accurate margin is 9.4%, 53.8% to 44.4%, and 398k votes. I would not be surprised if this state was under 5%, and potential flip if cyber is involved. They stopped count here on election night – the reason is clear now.
Best GOP audit targets:
Ocean, Monmouth, Hunterdon, Sussex
Source: https://t.me/CaptainKMapsandStats/107
Top 100 Worst Counties
Seth has listed New Jersey’s Ocean County as being among the Nation’s Top 100 Worst Counties in terms of abnormal trends during the 2020 election.
Methodology
Seth Keshel’s estimates are based on the percentage of voters who are registered to each party (where it’s possible to obtain this information) compared to the actual votes for each party. He examined these party trends over the last two decades, as well as population growth, which brought to light the strange and statistically unlikely outliers and anomalies that occurred in 2020. We explain this process, step by step, with visual examples, in our guide How to Predict Election Results Using Registration Data, so that you can investigate the numbers for yourself.
This video from Telegram also explains some of Seth’s approach to analyzing precincts.
Further Updates
Raw Data
We aim to publish links to both the raw election data and voter registration data for New Jersey so that citizens and researchers can analyze this information for themselves.
Other Reports
A team of scientists from Election-Integrity.info produced the following reports:
-
“2020 Presidential Election Startling Vote Spikes” which includes a section on New Jersey
-
“2020 Presidential Election Contrast Analysis” which lists New Jersey as the state with the 10th highest number of unexpected Biden votes
Election Audit Groups on Telegram
Further updates from Seth Keshel can be found on his Telegram Channel @ElectionHQ2024.
To join the grassroots efforts in pursuing election integrity and audits of the 2020 election in New Jersey, you can join the following groups on Telegram:
For other states, see our Full List of Telegram Channels.
ElectionFraud20.org and Seth Keshel have no affiliation with nor any responsibility for these channels. Discern carefully, as some users and even admins of channels have shown obstruction to transparent audits of our elections.