See also the main article on Nevada, for documented election integrity issues and further reports.

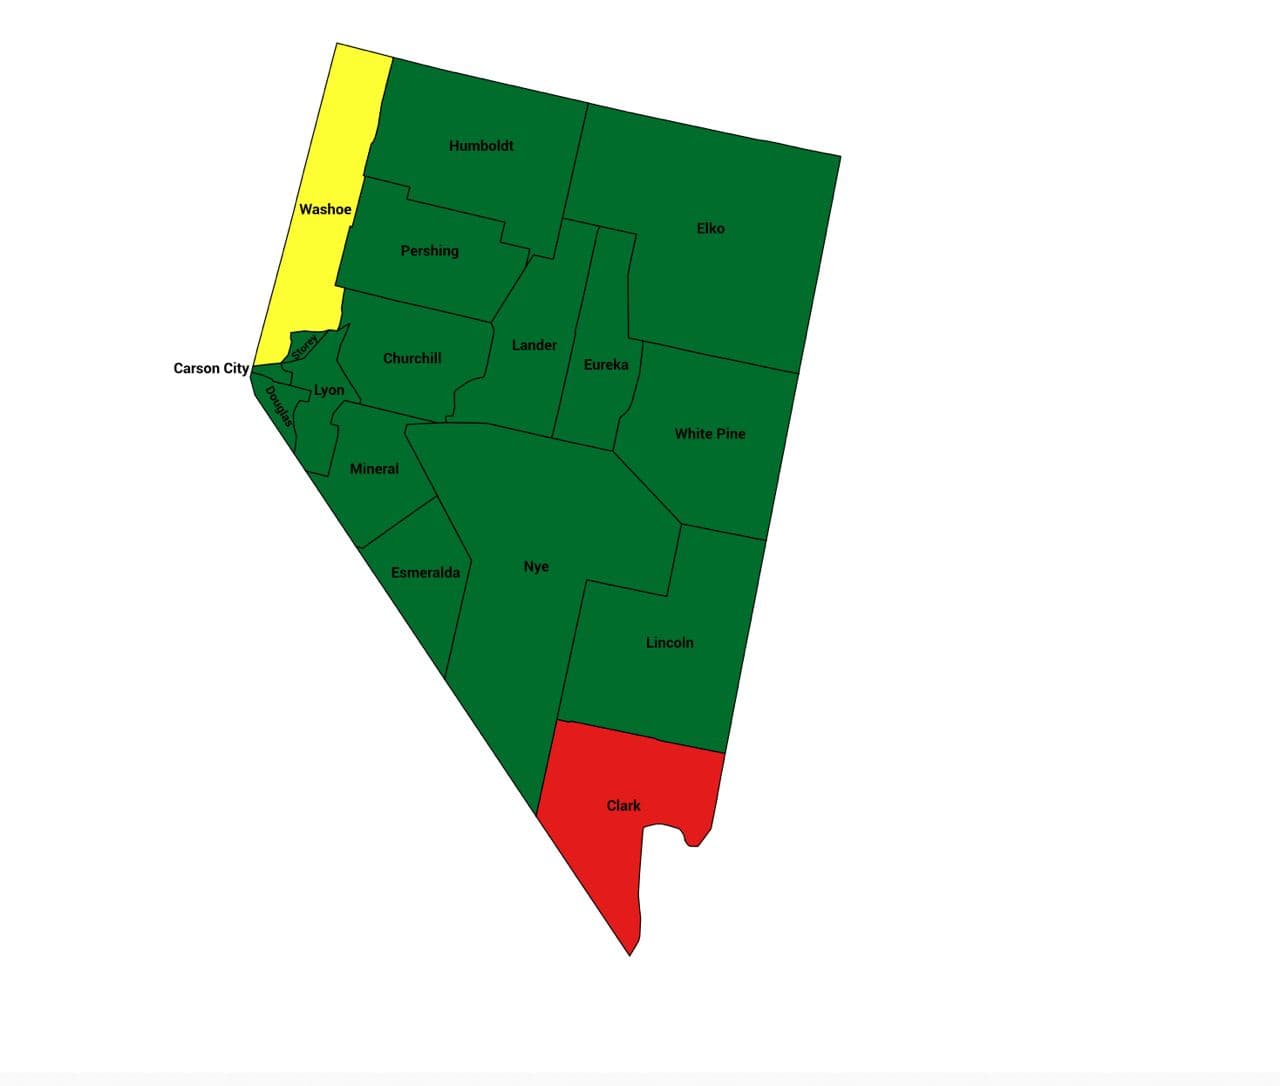
Former US military intelligence officer and statistical analyst Seth Keshel analyzed the trends of voter registrations versus actual votes. The following report indicates which counties’ vote counts align with the trend in voter registrations and which have small or large divergences. Each county is flagged as red, yellow, or green, based on whether the 2020 vote totals aligned with the expected trends (as past decades demonstrate they typically do), or if they diverged in statistically unlikely ways.

Seth Keshel County Trend Map for Nevada

Chart legend: Red = Rampant Fraud, Yellow = Likely/Suspect, Green = Clean

Trump votes Biden votes Other votes
Officially reported results 669890 (47.67%) 703486 (50.06%) 31900 (2.27%)
Estimate of potential fraud 100000 (7.1%)
Estimate of actual result
(with fraud removed)
669890 (51.3%) 603486 (46.2%) 31900 (2.4%)

I’ve done several deep dives that included Nevada, so won’t go into too much detail here. 14 counties + Independent Carson City trended roughly as expected, no real demand for forensics in those unless a statewide audit happened.

Washoe is a little heavy on votes but not smoking gun like Clark County is.

Please review Nevada attachment for more details.

Estimate of 100k+ excess votes in Clark County for Joe Biden.

A forensic audit is a must for Clark County, but governor, Sec. State, and legislature are major issues.

Seth Keshel County Trends for Nevada

Seth Keshel County Trends for Nevada

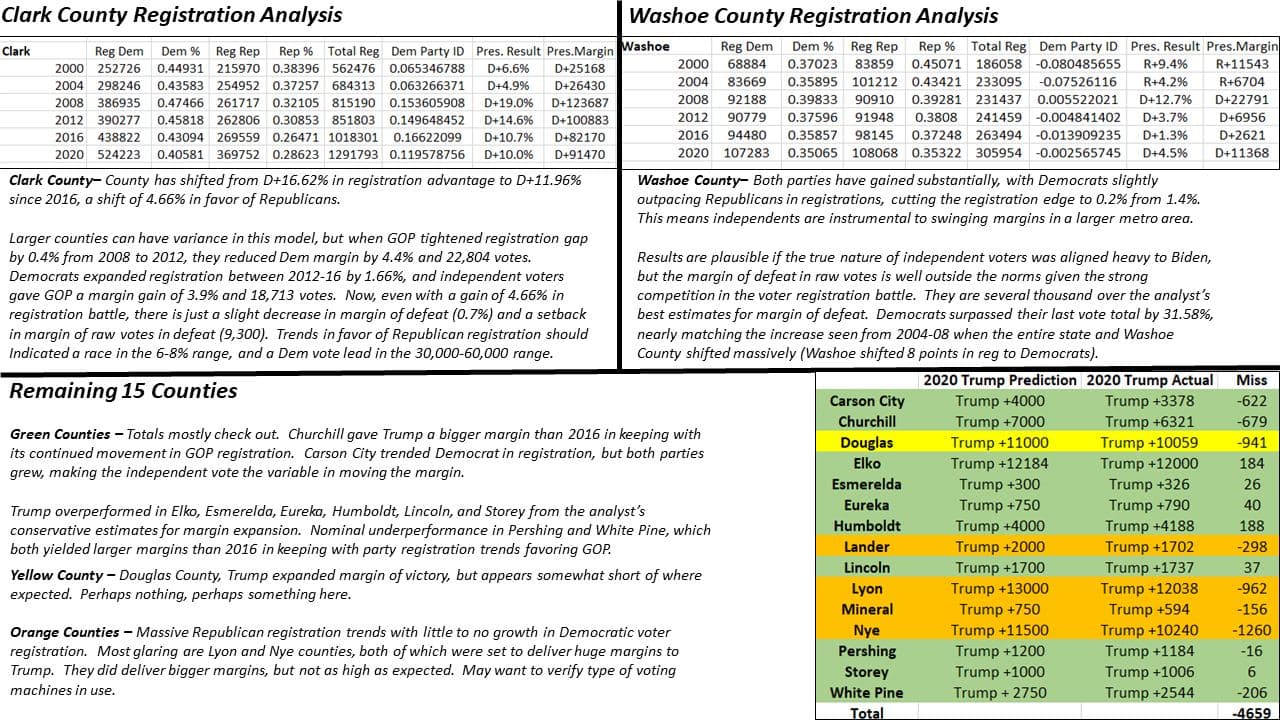
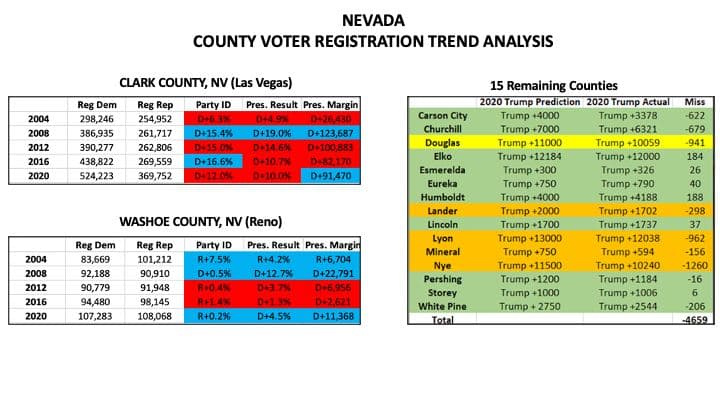
The counties highlighted green, above, had vote counts very close to Seth’s predictions based on party registration numbers. Clark, Washoe and a number of others (flagged yellow and orange) trended unexpectedly, which deserve closer inspection.

Source: https://t.me/CaptainKMapsandStats/17

Top 100 Worst Counties

Seth has listed Nevada’s Clark and Washoe counties as being among the Nation’s Top 100 Worst Counties in terms of abnormal trends during the 2020 election.

Clark County

The following chart displays the precincts within Clark County with the highest number of anomalous Biden votes:

Washoe County

Events & Presentations

DatePresenterLocationLink
Thu Mar 10, 2022

Seth Keshel

Las Vegas, Nevada More info

Further Updates

Methodology

Seth Keshel’s estimates are based on the percentage of voters who are registered to each party (where it’s possible to obtain this information) compared to the actual votes for each party. He examined these party trends over the last two decades, as well as population growth, which brought to light the strange and statistically unlikely outliers and anomalies that occurred in 2020. We explain this process, step by step, with visual examples, in our guide How to Predict Election Results Using Registration Data, so that you can investigate the numbers for yourself.

This video from Telegram also explains some of Seth’s approach to analyzing precincts.

Raw Data

We aim to publish links to both the raw election data and voter registration data for Nevada so that citizens and researchers can analyze this information for themselves.

Show Raw Data Links

Certified Election Results
Currently unknown

In most states, the certified election results are available from the Secretary of State or State Board of Elections. Check their website for details. States are also required by HAVA law to inform the public of how many absentee ballots were both sent and received to uniformed services and overseas voters.
Voter Registration Rolls/Database
Currently unknown

In some states, these are freely available from the Secretary of State or State Board of Elections. Check their website. In other states, voter rolls must be purchased and/or accessed via a signed legal agreement. Some officials are also obstructing access to the rolls, to make auditing difficult. Let us know via Telegram or via the comment section below if you experience issues.
Cast Vote Records Ordros Analytics has collated a repository of Cast Vote Records (CVRs) which list everyone who voted in the Nov 2020 election. Only some counties in some states are represented, but the list is growing.
The New York Times 2020 Election Results Results for all states, with several maps and charts.
Data Explorer Tool Our own tool for inspecting the 2020 New York Times data, including the time-series data of how the counting progressed. Also provides download links for raw JSON or CSV data, including counts for every precinct and county.
US Election Atlas
Recommended when doing trend analysis, as shown on this page

Detailed results for 2020 and previous years. Some data is freely accessible on their website, while some, such as detailed historic results in CSV format, are purchasable for a fee.
This appears to be the source commonly used by Seth Keshel for his analysis, although we have not officially confirmed this.

Additional Misc Nevada Data

A collection of other datasets and reports, collated for the purpose of auditing the election results.

2020 General Election Data & Research A broad collection of national stats, vote and registration counts, time-series data, voting machine information and manuals, PDF reports, and other research collated by citizen auditors.
Election Night Time-Series Data from Edison
Unverified

Provides more detail than is available from the New York Times, and includes numerous interactive charts.
Download ZIP of Raw Data
Published by Jeff O’Donnell, MagaRaccoon.com
Weekly HAVV SSN Reports
Unverified

Social Security Administration (SSA) Weekly Data for Help America Vote Verification (HAVV) Transactions by State.
Learn more about this data
Published by Jeff O’Donnell, MagaRaccoon.com

If you have additional sources of election data, please let us know via Telegram, Twitter or post a comment below to assist.

One searchable database of voter registration data is being published online at VoteRef.com where visitors are be able to “crowd-source” any errors.

Get Involved

Volunteers are needed to help verify the irregularities found. One key way this is done is through voter canvassing, with teams analyzing the county and state records and voter rolls, and others going door-to-door to identify whether the records match the actual residents living at the address.

Learn more about Canvassing Volunteer in Your State

Visitor Comments

Show Comments