See also the main article on Montana, for documented election integrity issues and further reports.
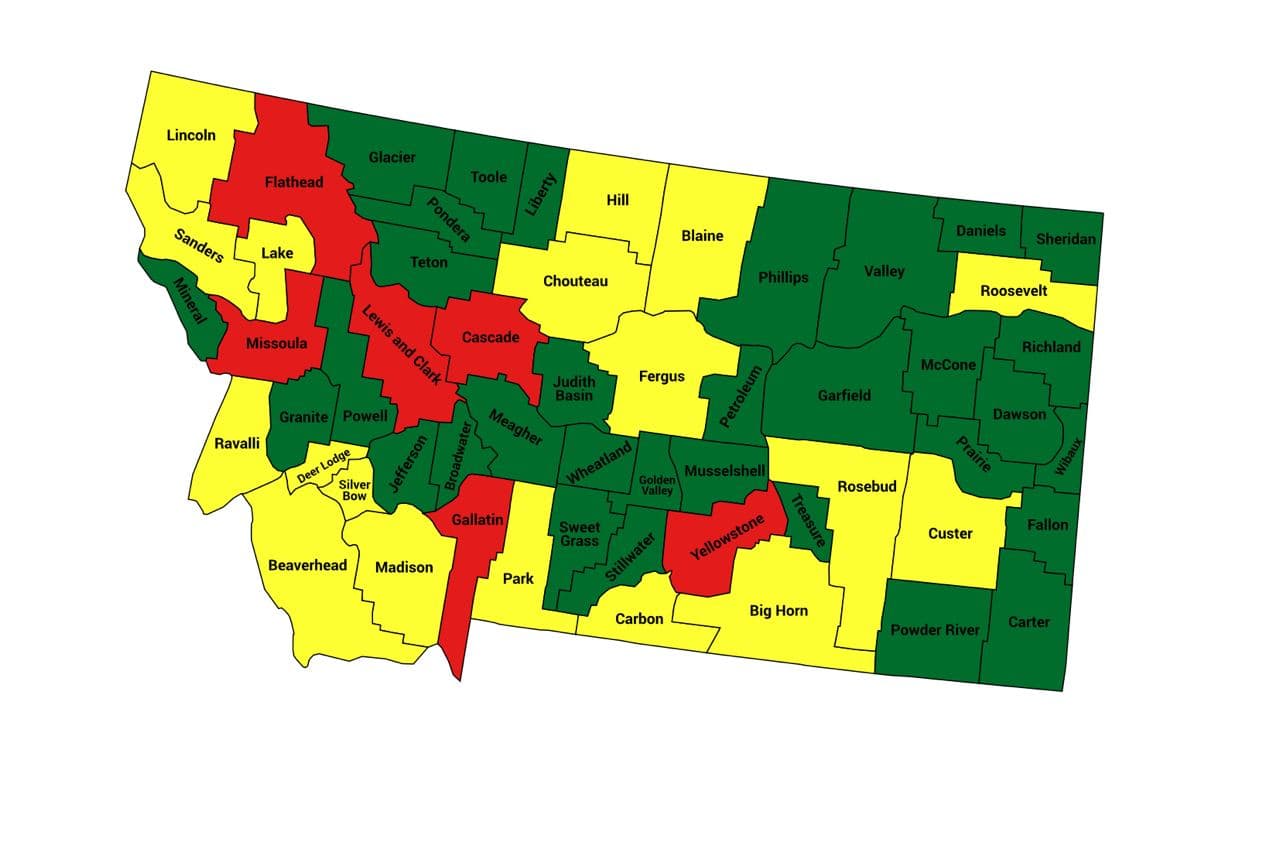
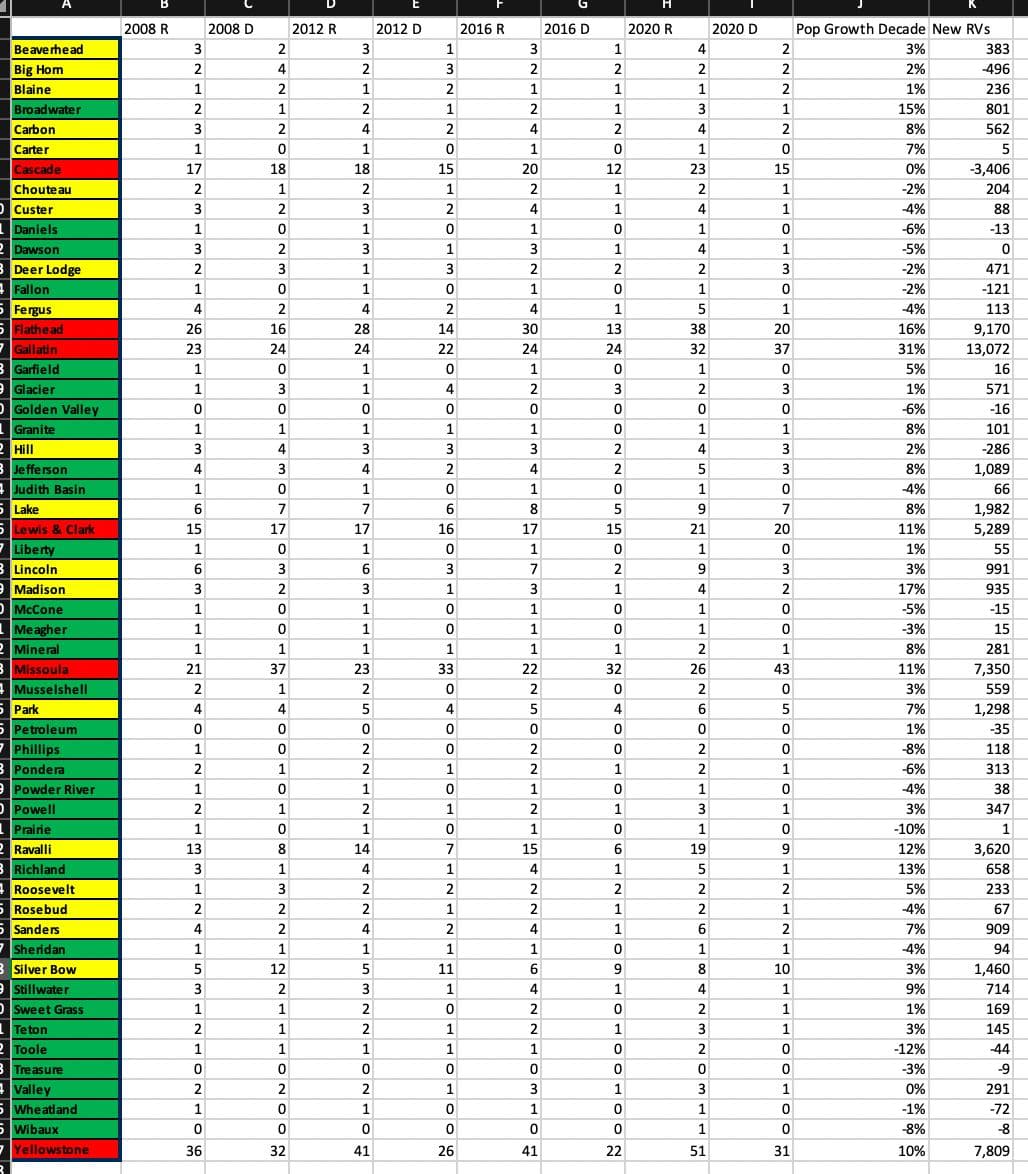
Former US military intelligence officer and statistical analyst Seth Keshel analyzed the trends of voter registrations versus actual votes. The following report indicates which counties’ vote counts align with the trend in voter registrations and which have small or large divergences. Each county is flagged as red, yellow, or green, based on whether the 2020 vote totals aligned with the expected trends (as past decades demonstrate they typically do), or if they diverged in statistically unlikely ways.

| Trump votes | Biden votes | Other votes | |
|---|---|---|---|
| Officially reported results | 343602 (56.92%) | 244786 (40.55%) | 15273 (2.53%) |
| Estimate of potential fraud | 46000 (7.6%) | ||
| Estimate of actual result
(with fraud removed) |
343602 (61.6%) | 198786 (35.6%) | 15273 (2.7%) |
Trump added 64k votes in 4 years, a GOP record, but curiously, Biden, while losing by 16.4%, gained 67k votes as the state registered just 58k new voters.
I think target here was actually senate race which was an 11% race between Bullock and Daines; also a gubernatorial race. Keep in mind, there is a big scrap in Missoula County right now over about 6,000 ballots thought to be illegally cast.
Montana does not register by party, so using working class/population growth trends.
| Red – Obviously Ugly | (6 counties) |
| Yellow – Suspect/Likely Fraud | (19 counties) |
| Green – Clean | (31 counties) |
Estimates for excess votes based on pop. growth/trends:
| Cascade | 3k |
| Flathead | 5k |
| Gallatin | 7k |
| Lewis and Clark | 3k |
| Missoula | 6k |
| Yellowstone | 6k |
I estimate 46k excess votes statewide. If accurate, and counting ONLY excess Biden vote growth, Trump should have won this state about 61.6% to 35.6%, or 26.0% - in other words, a shellacking that tracks accurately with the progression from 2012 to 2016.
Source: https://t.me/CaptainKMapsandStats/23
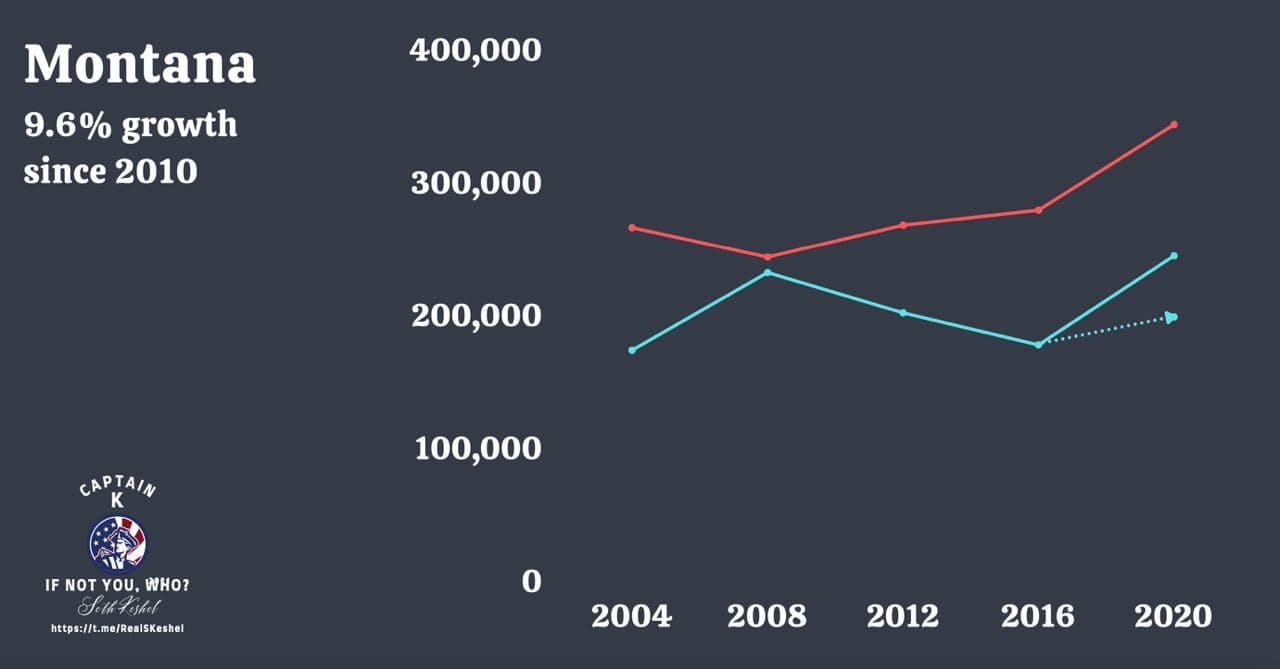
The election fraud in Montana from 2020 is very easy to see in this trend graph.
Notice the opposing trends (how the lines move in opposing directions), something that is present since the high turnout era began in 2004.
Obama ran it tight in 2008 (lost by only 2.4%) and then the Republican/GOP trend picked up steam, with a 13.7% Romney win, 20.4% Trump win…
And then we see a GOP record vote gain of 64k this year… Only to be met with a record Democrat gain of 67k… after two consecutive elections of losing votes – in spite of population growth of 100k per decade.
This makes Montana one of the most fraudulent states in terms of percentage of fraudulent votes. My light estimate is 46k fraudulent votes, about 8% of all votes.
Source: Telegram post, Sep 22, 2021
Top 100 Worst Counties
Seth has listed Montana’s Yellowstone County as being among the Nation’s Top 100 Worst Counties in terms of abnormal trends during the 2020 election.
Events & Presentations
| Date | Presenter | Location | Link |
|---|---|---|---|
| Wed Sep 22, 2021 | Seth Keshel, David Clements, and Dr. Douglas Frank |
Missoula, Montana | More info |
Further Updates
Methodology
Seth Keshel’s estimates are based on the percentage of voters who are registered to each party (where it’s possible to obtain this information) compared to the actual votes for each party. He examined these party trends over the last two decades, as well as population growth, which brought to light the strange and statistically unlikely outliers and anomalies that occurred in 2020. We explain this process, step by step, with visual examples, in our guide How to Predict Election Results Using Registration Data, so that you can investigate the numbers for yourself.
This video from Telegram also explains some of Seth’s approach to analyzing precincts.
Raw Data
We aim to publish links to both the raw election data and voter registration data for Montana so that citizens and researchers can analyze this information for themselves.
Election Audit Groups on Telegram
Further updates from Seth Keshel can be found on his Telegram Channel @ElectionHQ2024.
To join the grassroots efforts in pursuing election integrity and audits of the 2020 election in Montana, you can join the following groups on Telegram:
- Montana Audit Force
- Montana Audit Force Discussion
- Montana Election Integrity Project
- Montana One Six (helping Jan 6 political prisoners)
- Montana One Six Discussion (helping Jan 6 political prisoners)
For other states, see our Full List of Telegram Channels.
ElectionFraud20.org and Seth Keshel have no affiliation with nor any responsibility for these channels. Discern carefully, as some users and even admins of channels have shown obstruction to transparent audits of our elections.