See also the main article on Kansas, for documented election integrity issues and further reports.
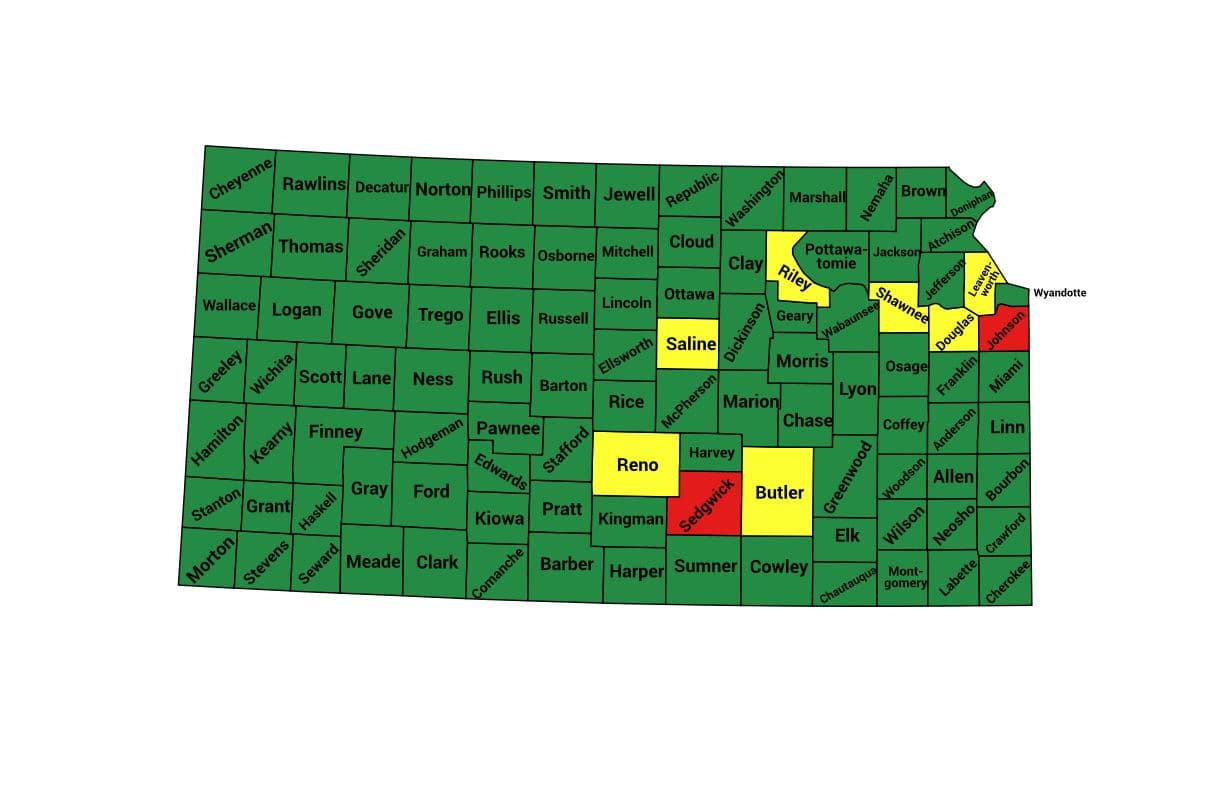
Former US military intelligence officer and statistical analyst Seth Keshel analyzed the trends of voter registrations versus actual votes. The following report indicates which counties’ vote counts align with the trend in voter registrations and which have small or large divergences. Each county is flagged as red, yellow, or green, based on whether the 2020 vote totals aligned with the expected trends (as past decades demonstrate they typically do), or if they diverged in statistically unlikely ways.

| Trump votes | Biden votes | Other votes | |
|---|---|---|---|
| Officially reported results | 771406 (56.2%) | 570323 (41.5%) | 31608 (2.3%) |
| Estimate of potential fraud | 48000 (3.5%) | ||
| Estimate of actual result
(with fraud removed) |
771406 (58.2%) | 522323 (39.4%) | 31608 (2.4%) |
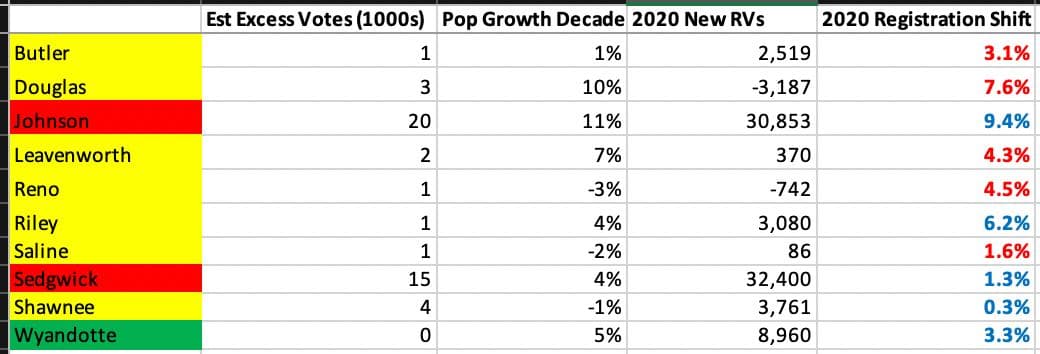
Kansas is quite a bit worse off than Nebraska, with most of the talk focusing on Johnson County, which voted Democrat for the first time since 1916! Trump won the county by 8,000 votes in 2016, despite losing 21,000 votes compared with Romney in the previous election, and if the registration totals by party are accurate, these indicated a big shift left for 2020. Trump still gained 18k back in 2020, not quite to Romney’s total (158k), but Biden’s gain is ridiculous – 54k (41%) improvement in one election cycle! In 2008 Obama gained 29k votes, but that was with a drop in Republican votes. This leads us to reason that Johnson has at least 20,000 more Biden votes than the trends suggest is reasonable.
In Sedgwick (Wichita), Trump set a record Republican vote gain for one election, only to be outpaced by a massive record Democrat gain. In Sedgwick, we estimate 15,000 more votes than would be expected. This county is a prime target for a forensic audit.
If Biden has 48,000 more votes here than he should, Trump should have won with 58.2% to Biden’s 38.0%, or 249k votes.
Best GOP county audit targets: Sedgwick, Leavenworth
Need to audit: Johnson, Shawnee
Source: https://t.me/CaptainKMapsandStats/112
Top 100 Worst Counties
Seth has listed Kansas’s Johnson and Sedgwick counties as being among the Nation’s Top 100 Worst Counties in terms of abnormal trends during the 2020 election.
Johnson County
Johnson County appears to have approximately 20,000 excess Biden votes than would be expected. The county was flipped in 2020 for first time since 1916!
Seth’s video below contains a detailed overview of the 16 year trendline and registration numbers.
Source: Telegram Post, Sep 6, 2021
The following heat map shows which precincts within Johnson County diverged the most from expected trends and should be investigated:
Sedgwick County
Estimated 15,000 excess Biden votes.
Source: Telegram Post, Sep 6, 2021
Further Analysis on Kansas
This video, featuring Seth Keshel, dives into some of the Kansas counties, starting at 15min 50sec mark.
Methodology
Seth Keshel’s estimates are based on the percentage of voters who are registered to each party (where it’s possible to obtain this information) compared to the actual votes for each party. He examined these party trends over the last two decades, as well as population growth, which brought to light the strange and statistically unlikely outliers and anomalies that occurred in 2020. We explain this process, step by step, with visual examples, in our guide How to Predict Election Results Using Registration Data, so that you can investigate the numbers for yourself.
This video from Telegram also explains some of Seth’s approach to analyzing precincts.
Raw Data
We aim to publish links to both the raw election data and voter registration data for Kansas so that citizens and researchers can analyze this information for themselves.
Other News
-
Affidavits are being collected in Kansas. They’re also hoping to check their machines for cell-tower modems. Anyone with an outstanding Kansas affidavit should sign and return it, see The Jim Price Show.
-
Steve Watkins, a former Republican congressman from Kansas, listed a postal box at a UPS store as his residence on a state voter registration form while living temporarily at his parents’ home during a 2019 municipal election. Watkins was charged with three felonies - voting without being qualified, knowingly voting with more than one advance ballot, and interfering with the investigation intending to obstruct. He entered into a diversion agreement where his prosecution will be deferred for six months. If he complies with the terms of the agreement and pays a $250 fee, the charges will be dropped. (Source)
Election Audit Groups on Telegram
Further updates from Seth Keshel can be found on his Telegram Channel @ElectionHQ2024.
To join the grassroots efforts in pursuing election integrity and audits of the 2020 election in Kansas, you can join the following groups on Telegram:
- Kansas Audit Group
- Kansas Audit Force
- Kansas Audit Force Discussion
- Kansas One Six (helping Jan 6 political prisoners)
- Kansas One Six Discussion (helping Jan 6 political prisoners)
For other states, see our Full List of Telegram Channels.
ElectionFraud20.org and Seth Keshel have no affiliation with nor any responsibility for these channels. Discern carefully, as some users and even admins of channels have shown obstruction to transparent audits of our elections.