See also the main article on Illinois, for documented election integrity issues and further reports.
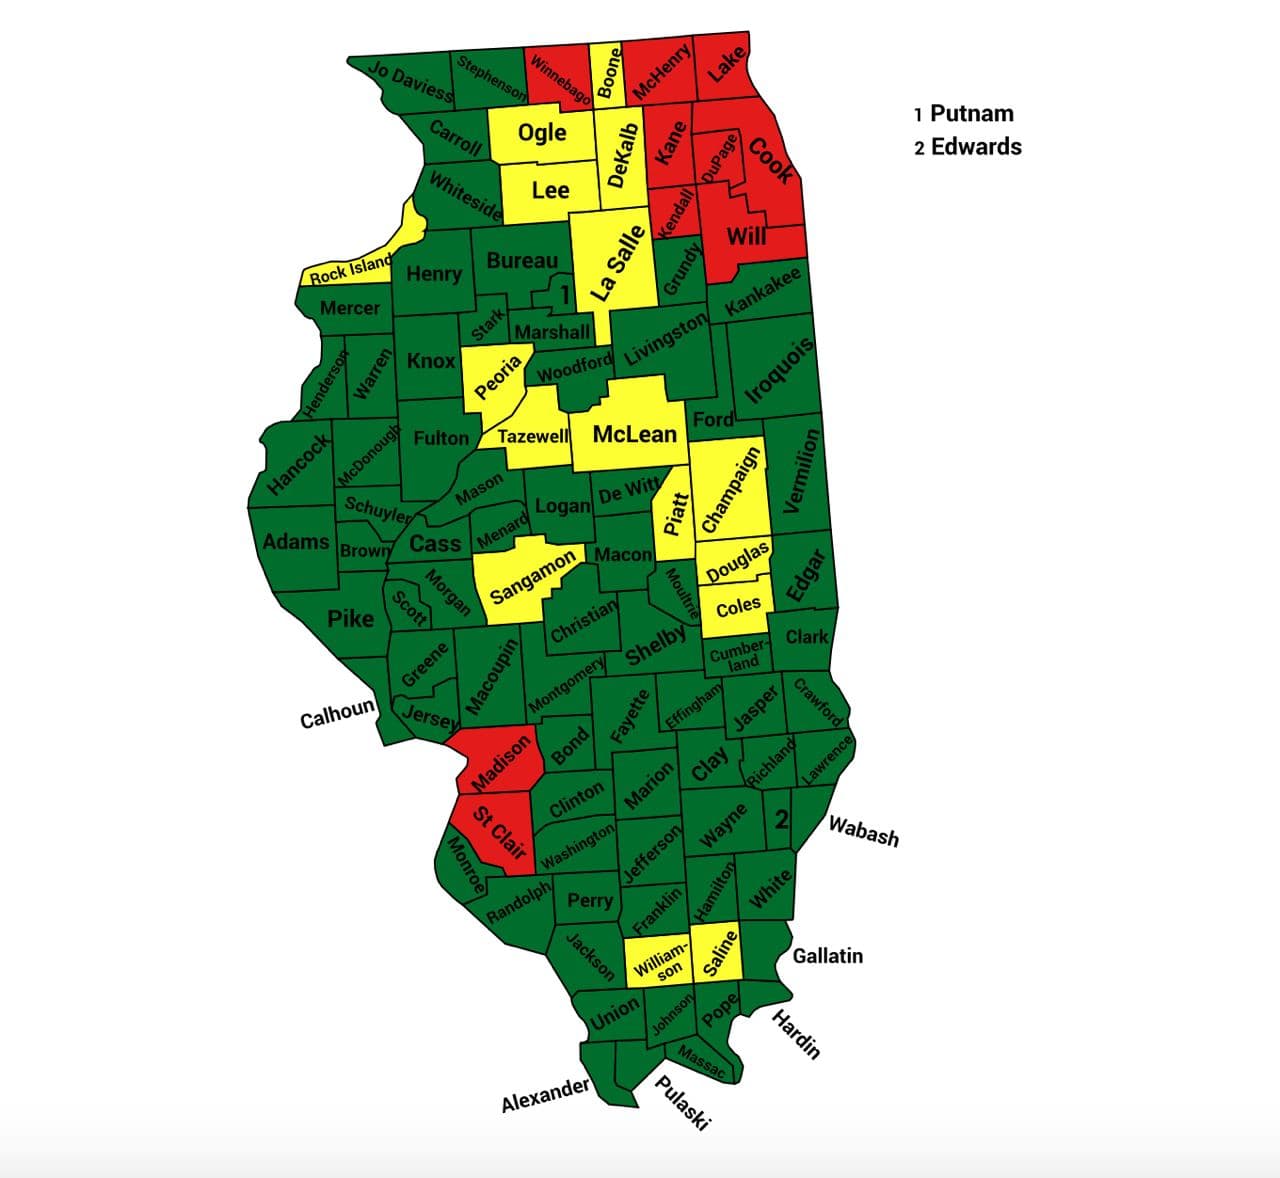
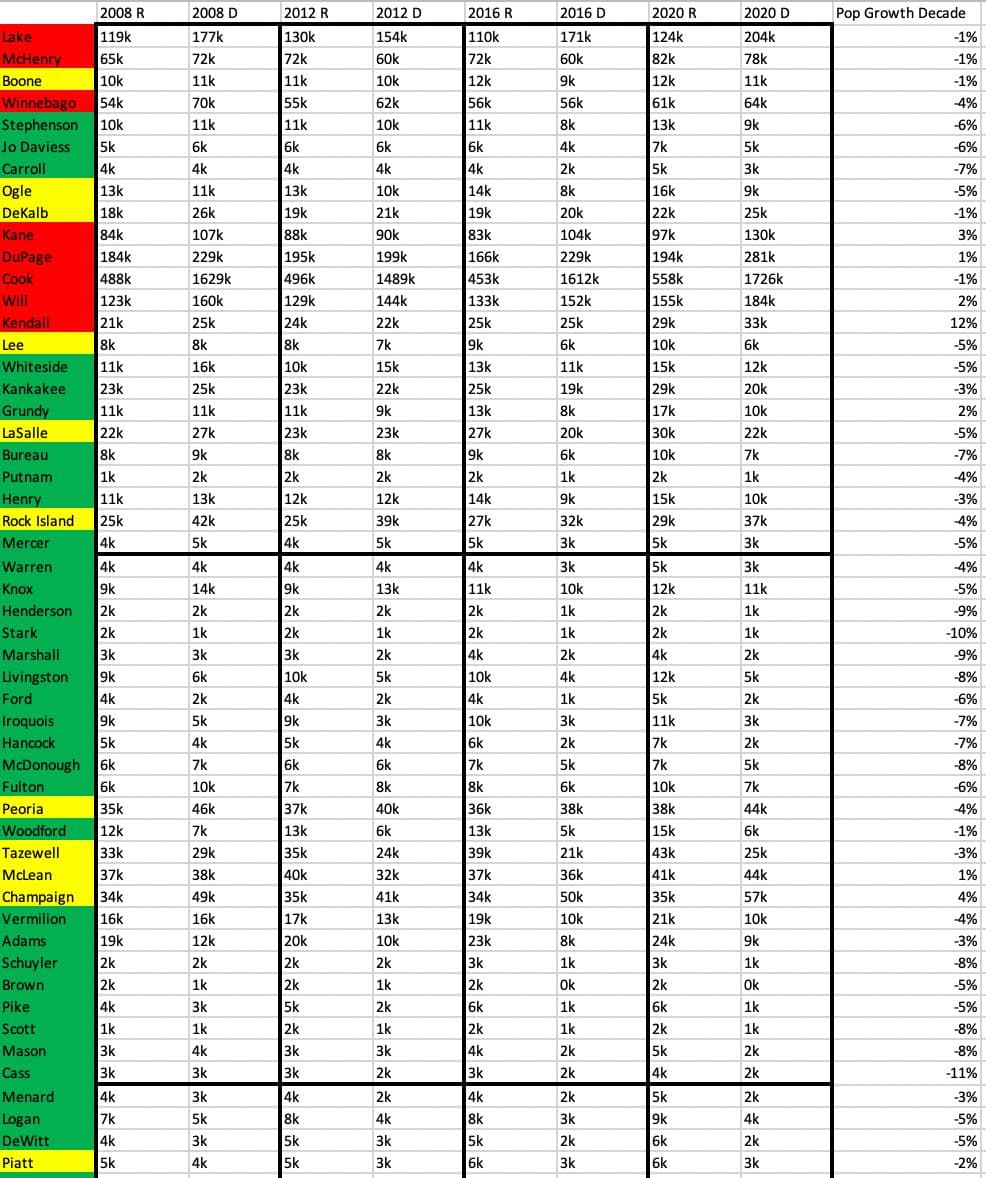
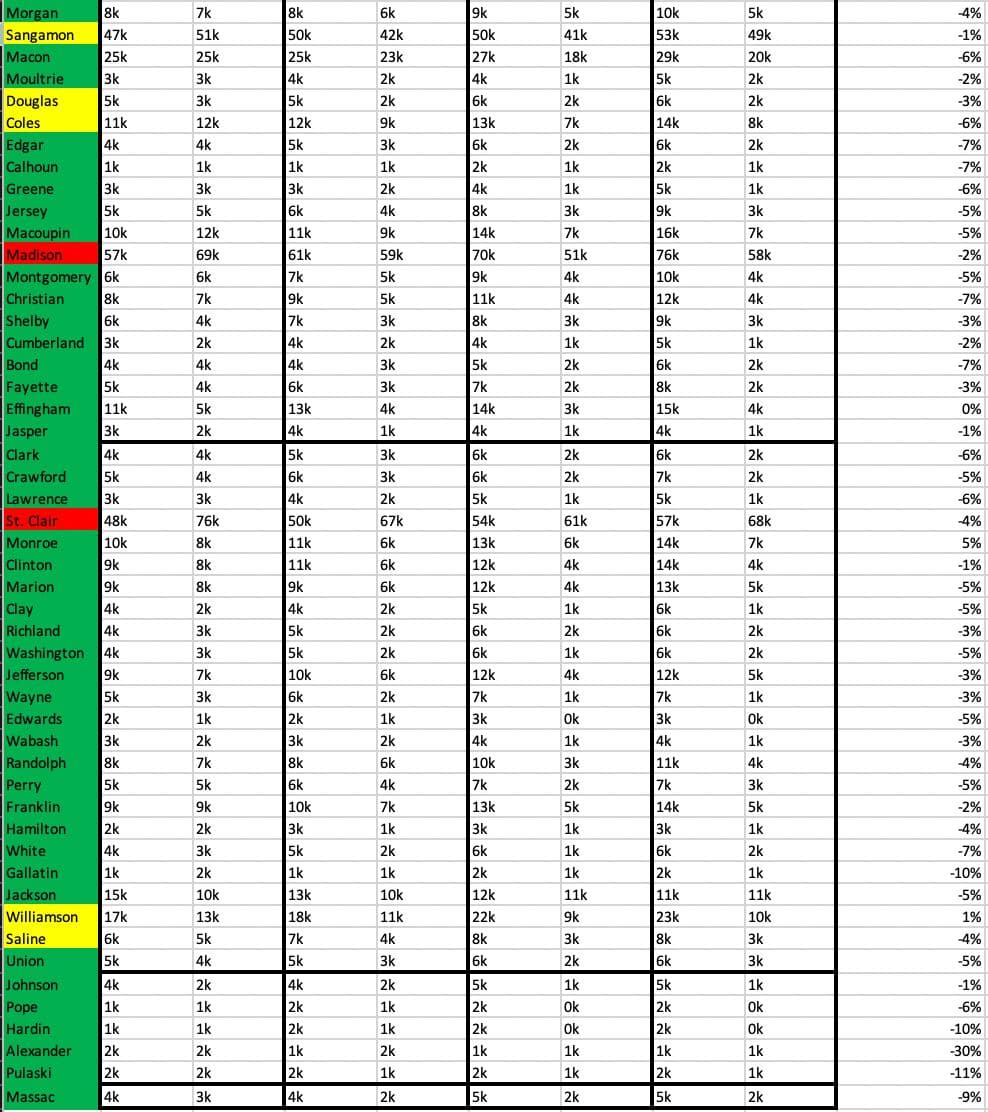
Former US military intelligence officer and statistical analyst Seth Keshel analyzed the trends of voter registrations versus actual votes. The following report indicates which counties’ vote counts align with the trend in voter registrations and which have small or large divergences. Each county is flagged as red, yellow, or green, based on whether the 2020 vote totals aligned with the expected trends (as past decades demonstrate they typically do), or if they diverged in statistically unlikely ways.

| Trump votes | Biden votes | Other votes | |
|---|---|---|---|
| Officially reported results | 2446891 (41.3%) | 3471915 (57.5%) | 72457 (1.2%) |
| Estimate of potential fraud | 295000 (4.9%) | ||
| Estimate of actual result
(with fraud removed) |
2446891 (43.0%) | 3176915 (55.8%) | 72457 (1.3%) |
Many have been asking me to get working on non-contested states so we can get audit groups organized. Here is a hotly requested one.
Trump is +301k from 2016, but loses the state by 80k extra thanks to Biden’s 382k gain.
Important to note that Biden is +53K from Obama (from IL) 2008 total, while Trump is +416k from McCain and +311k from Romney… In a state with a 0.1% DECREASE in population since 2010.
102 Counties
10 Red (Obviously Rigged)
16 Yellow (Likely/Minor Rigged)
76 Green (Clean) - see Greene and Jersey for textbook Rust Belt Shift examples since 2008
Most of the machinery is connected to Chicago, no surprise. Smaller network in center of state/Champaign area.
Stronger one across river from St. Louis.
I estimate Biden is 195K too heavy before we count Cook, where he is +97K over Obama ‘08. The question for Cook is “HOW MUCH?”
Likely not a Trump state, but single digits blue.
Source: https://t.me/CaptainKMapsandStats/20
Top 100 Worst Counties
Seth has listed Illinois’s Lake County as being among the Nation’s Top 100 Worst Counties in terms of abnormal trends during the 2020 election.
Methodology
Seth Keshel’s estimates are based on the percentage of voters who are registered to each party (where it’s possible to obtain this information) compared to the actual votes for each party. He examined these party trends over the last two decades, as well as population growth, which brought to light the strange and statistically unlikely outliers and anomalies that occurred in 2020. We explain this process, step by step, with visual examples, in our guide How to Predict Election Results Using Registration Data, so that you can investigate the numbers for yourself.
This video from Telegram also explains some of Seth’s approach to analyzing precincts.
Raw Data
We aim to publish links to both the raw election data and voter registration data for Illinois so that citizens and researchers can analyze this information for themselves.
Other Reports
A team of scientists from Election-Integrity.info produced the following reports:
-
“2020 Presidential Election Startling Vote Spikes” which includes a section on Illinois
-
“2020 Presidential Election Contrast Analysis” which discusses how Illinois unexpectedly gained a significant number of overall votes, despite a decrease in population
-
Illinois Leaks reports that DuPage County signed a contract with Dominion Systems which includes a clause that they will resist all Freedom of Information (FOIA) requests, where possible, and inform Dominion of all such occurrences. Read their report.
Election Audit Groups on Telegram
Further updates from Seth Keshel can be found on his Telegram Channel @ElectionHQ2024.
To join the grassroots efforts in pursuing election integrity and audits of the 2020 election in Illinois, you can join the following groups on Telegram:
For other states, see our Full List of Telegram Channels.
ElectionFraud20.org and Seth Keshel have no affiliation with nor any responsibility for these channels. Discern carefully, as some users and even admins of channels have shown obstruction to transparent audits of our elections.