See also the main article on Georgia, for documented election integrity issues and further reports.
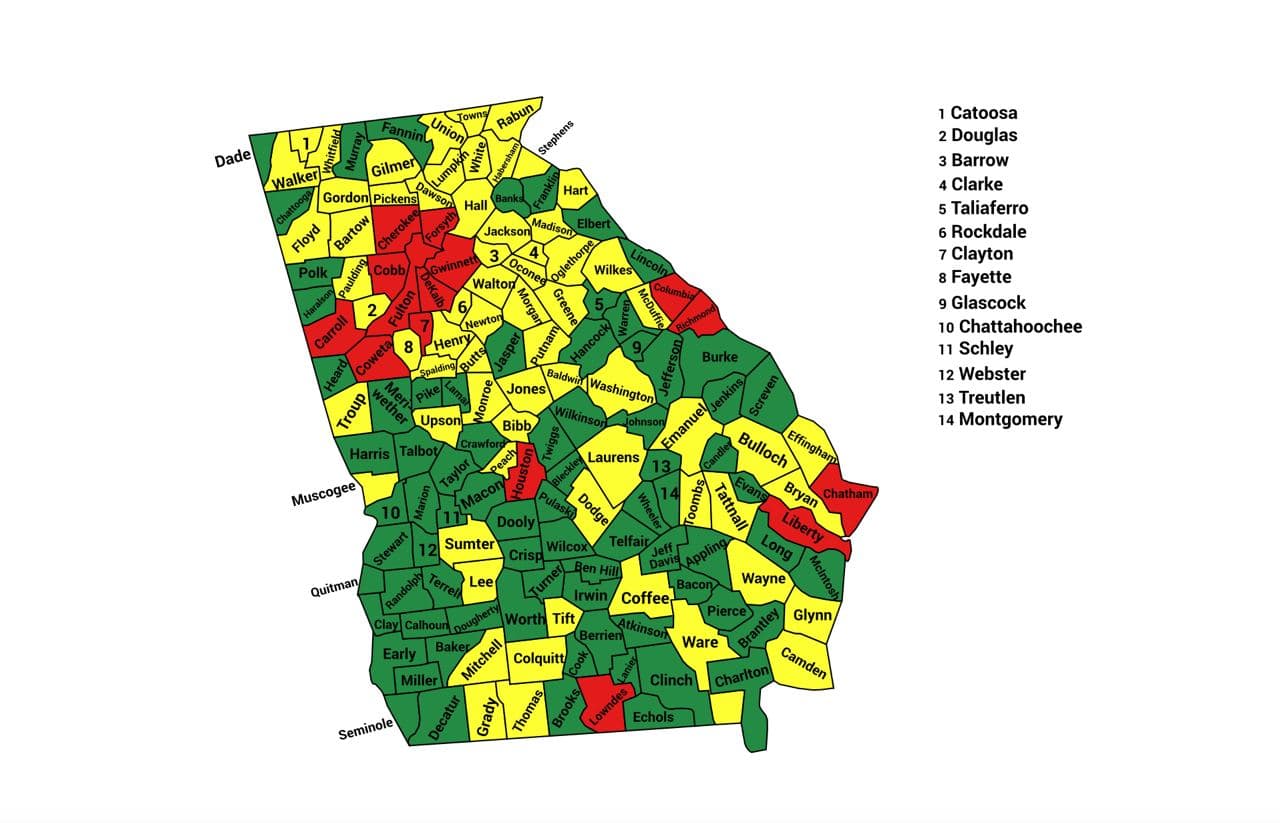
Former US military intelligence officer and statistical analyst Seth Keshel analyzed the trends of voter registrations versus actual votes. The following report indicates which counties’ vote counts align with the trend in voter registrations and which have small or large divergences. Each county is flagged as red, yellow, or green, based on whether the 2020 vote totals aligned with the expected trends (as past decades demonstrate they typically do), or if they diverged in statistically unlikely ways.

| Trump votes | Biden votes | Other votes | |
|---|---|---|---|
| Officially reported results | 2461854 (49.2%) | 2473633 (49.5%) | 64964 (1.3%) |
| Estimate of potential fraud | 299000 (6.0%) | ||
| Estimate of actual result
(with fraud removed) |
2461854 (52.4%) | 2174633 (46.3%) | 64964 (1.4%) |
Much like Arizona, Trump set a high-turnout era boom with 373k added votes, solidifying support with standard conservatives and winning more black men.
Democrats on the other hand, though vote gain is expected with population growth, had been stuck in same 104k vote loop (Obama down 70k in 2012, Clinton up 104k), only for Biden to gain a massive 597k in one election to win the state by an eyelash. 14,000 fraudulent votes kept David Perdue from winning on 11/3 and sent him to runoff.
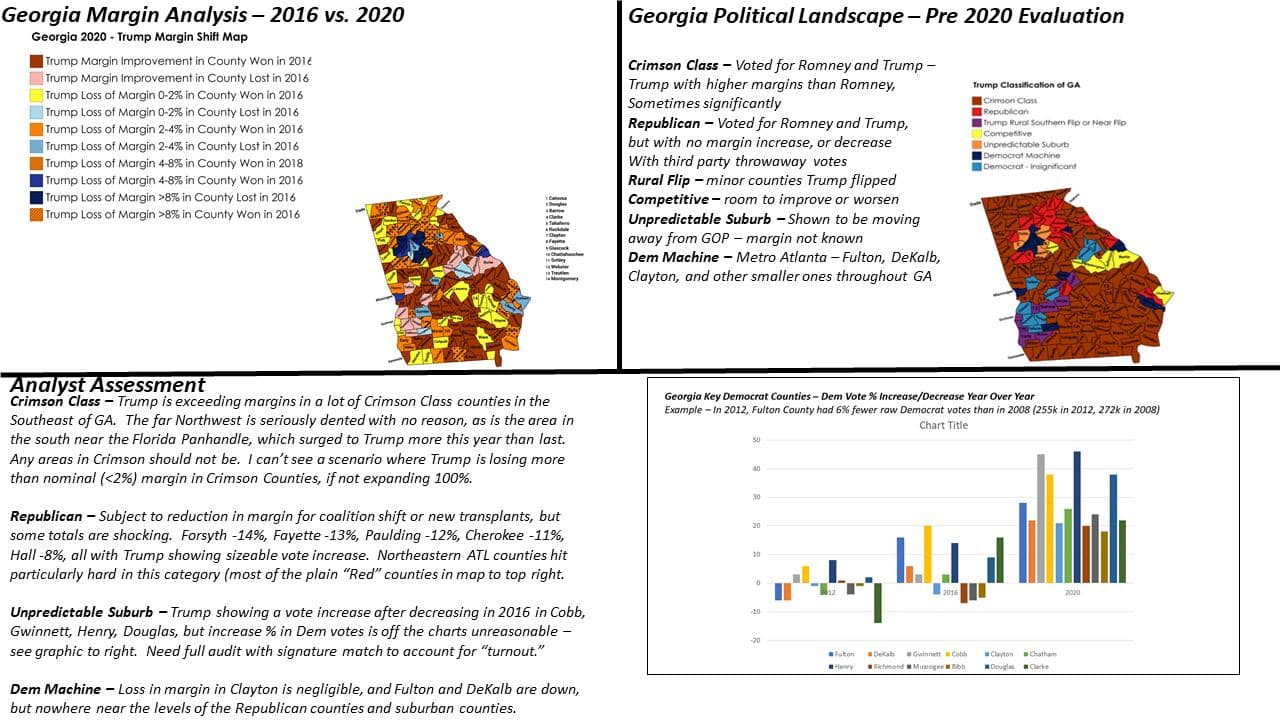
Pattern is heavy cheating in metro ATL counties and shaving in northern GA exurban and rural counties that are massively pro-Trump. I estimate that 311k of Biden’s votes are beyond what would be rationally expected, comprised of Gwinnett & Fulton 35k, DeKalb 30k, Cobb 25k.
If I’m accurate on 311k excess votes, Trump’s margin should have been roughly 52.6% to 46.1% (6.5%) with a margin of 299k votes.
Best targets for audits (Republican-len): Carroll, Cherokee, Columbia, Coweta, Forsyth, Houston, Lowndes
Source: https://t.me/CaptainKMapsandStats/71
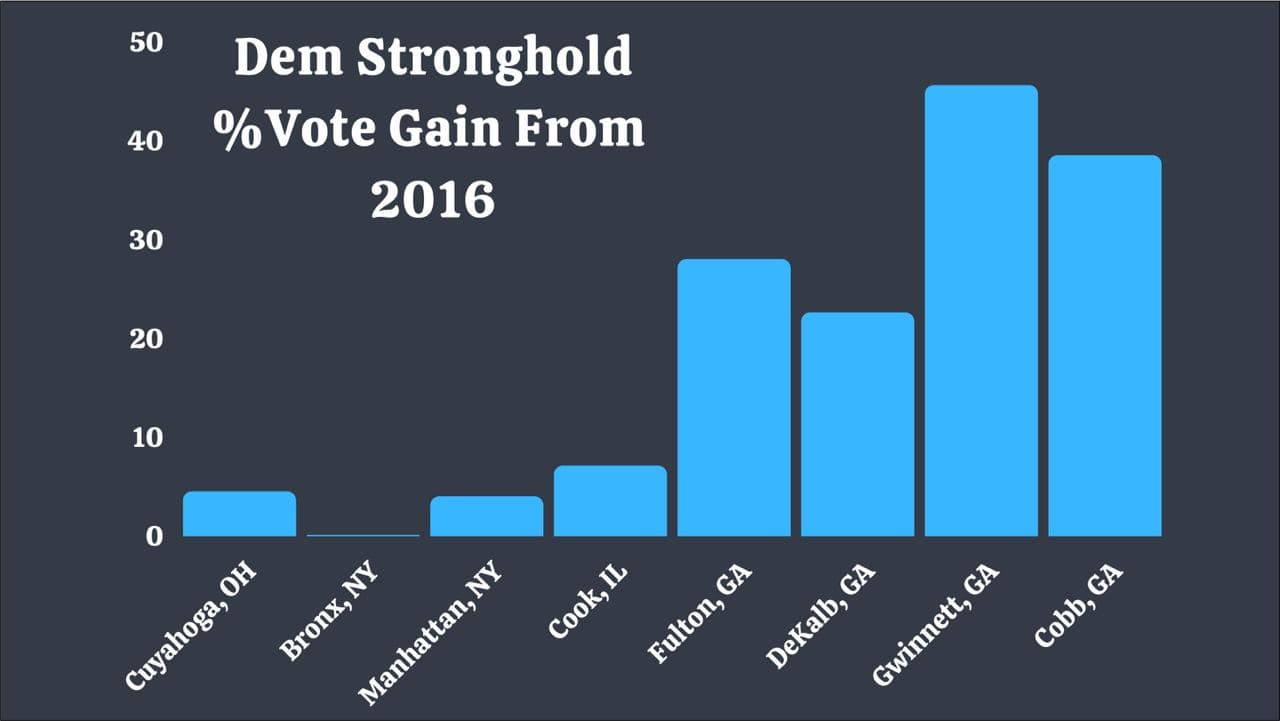
This chart shows the bizarre differences in Democrat vote results. Why did these four counties in Georgia have 20-50% more votes in 2020 than in 2016, when other strongly Democrat counties (“strongholds”) barely even reach a 7% increase?
Source: https://t.me/ElectionHQ2024/766
Georgia Voter Roll Analysis
By Seth Keshel, Aug 23, 2021. PDF source.
This pertains to voter rolls in four Georgia counties, dated 4 February 2021. Those counties are Forsyth, Cherokee, Dekalb, and Gwinnett, which hold an estimated 82,000 excess Biden votes, roughly 70,000 higher than Biden’s certified win total in Georgia.
Total registered voters by county as of Feb 4, 2021:
| Forsyth | 173,189 |
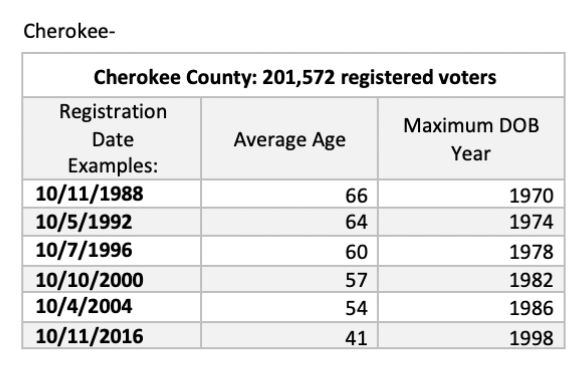
| Cherokee | 201,572 |
| DeKalb | 579,760 |
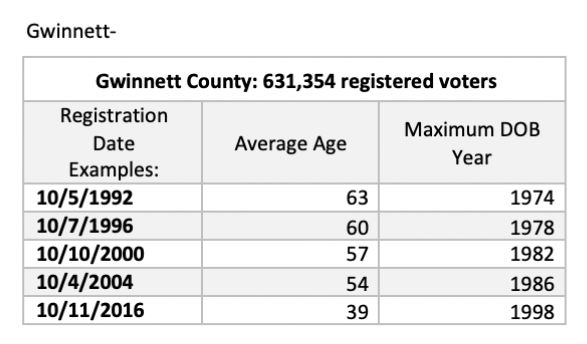
| Gwinnett | 631,354 |
Why are we looking at these counts? Here are the average number of voters entered on a random day:
| Forsyth | 15.9 | (10,882 dates recorded) |
| Cherokee | 16.0 | (12,623 dates recorded) |
| DeKalb | 39.1 | (14,814 dates recorded) |
| Gwinnett | 41.2 | (15,319 dates recorded) |
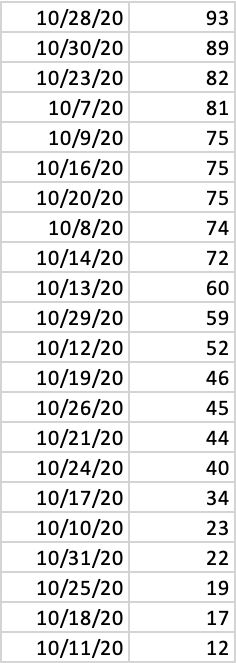
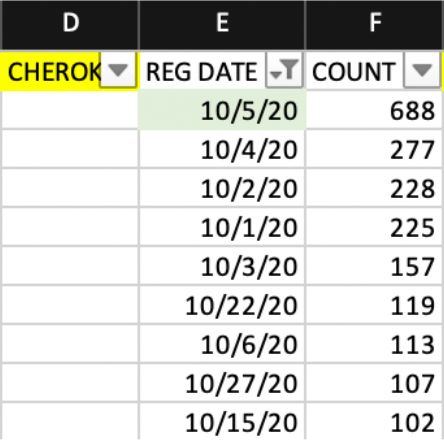
Now why do we have such a tremendous flood of registered voters, far surpassing the average daily entries, right before elections? See the chart below. Of course we could expect voters to be added at a higher rate leading up to elections, but every single day in October at numbers blowing away the average? Note that this is not just a 2020 thing – it appears to be something right before every election for decades.
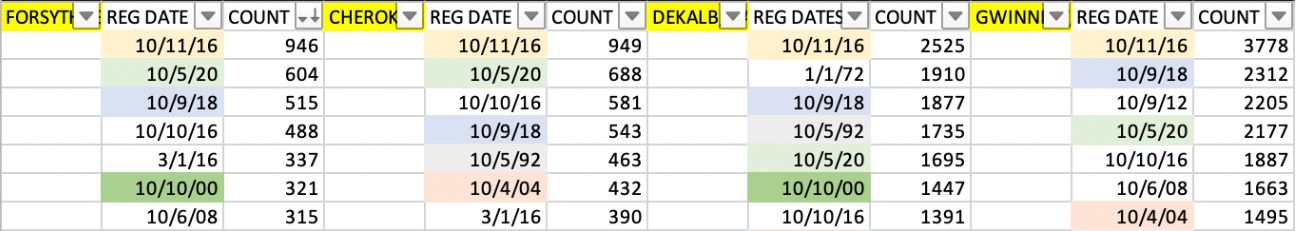
In Cherokee County, where I’ve estimated Biden to be 12,000 votes too high, 16 registered voters is the normal per day in which voters are registered, going back many decades. We can adjust for a higher number leading up to elections.
They look like this:
Notice that voters are being registered every day. Then how, in the same month, do we also find entries like this? Given that voters are being registered daily, there does not appear to be a reason for a backlog:
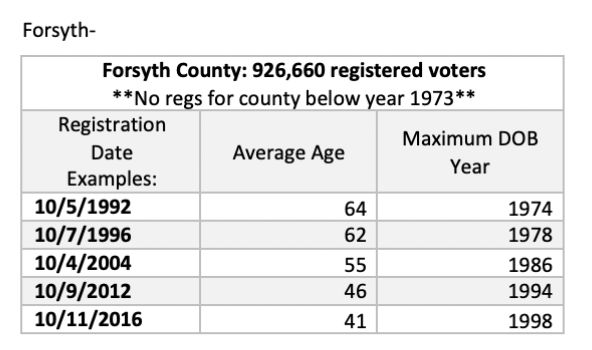
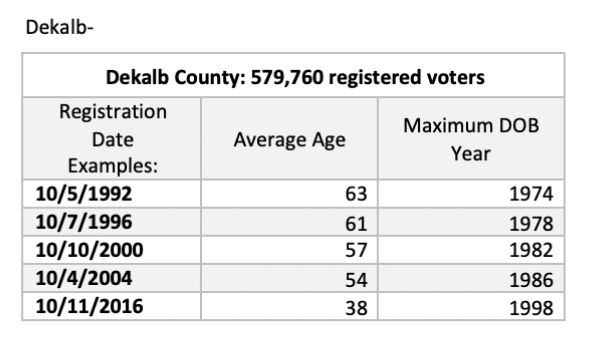
Age of Voters
Most voters who are first time registrants, unless they’re moving in from somewhere else (which GA does have at a higher-than-normal number), are going to be younger, from 18-30, typically.
Why then, do these counties have such high average ages in the dates leading up to an election? Note that this graphic below isn’t even 2020-centric. The question to me is, how long has this sort of registration type been going on?
Final Assessment
While not smoking-gun-proof of conspiracy, these numbers, showing such a distortion from not only the typical registration patterns, but the ones leading up to elections that are near-normal, may be indicative of methodology for registering “phantom” voters – as in, voters that are not real, but who are mailed absentee ballots.
These numbers are either indicative of outright malfeasance, or they can be easily explained by county officials and the Georgia Secretary of State. They are so out of line with ordinary registration trends that they must be explained. If you are local, demand answers for these unbelievable distortions in registration data.
Top 100 Worst Counties
Seth has listed Georgia’s Cherokee, Cobb, Dekalb, Forsyth, Fulton, and Gwinnett counties as being among the Nation’s Top 100 Worst Counties in terms of abnormal trends during the 2020 election.
Bibb County
Chatham County
The following graphic shows a map of which precincts in the county had the most abnormal results in 2020:
Cherokee County
The following PDF shows a map of which precincts in the county had the most abnormal results in 2020:
Columbia County
Dekalb County
Forsyth County
Fulton County
Gwinnett County
Events & Presentations
| Date | Presenter | Location | Link |
|---|---|---|---|
| Fri Feb 18, 2022 | Seth Keshel, Kandiss Taylor, and Mike Lindell |
Atlanta, Georgia | More info |
| Mon Dec 6, 2021 | Seth Keshel and Draza Smith |
Savannah, Georgia | More info |
Methodology
Seth Keshel’s estimates are based on the percentage of voters who are registered to each party (where it’s possible to obtain this information) compared to the actual votes for each party. He examined these party trends over the last two decades, as well as population growth, which brought to light the strange and statistically unlikely outliers and anomalies that occurred in 2020. We explain this process, step by step, with visual examples, in our guide How to Predict Election Results Using Registration Data, so that you can investigate the numbers for yourself.
This video from Telegram also explains some of Seth’s approach to analyzing precincts.
Raw Data
We aim to publish links to both the raw election data and voter registration data for Georgia so that citizens and researchers can analyze this information for themselves.
Further Updates
Seth gave a presentation in Kennesaw, Georgia, on August 24, 2021. See his post.
Other Reports
-
A team of scientists from Election-Integrity.info produced the following reports:
-
“2020 Presidential Election Startling Vote Spikes” which includes a section on Georgia
-
“2020 Presidential Election Contrast Analysis” which lists Georgia as the state with the 8th highest number of unexpected Biden votes
-
-
Atlanta, Georgia Election Fingerprints, by wwrkds
-
See also the main Georgia article for more
Election Audit Groups on Telegram
Further updates from Seth Keshel can be found on his Telegram Channel @ElectionHQ2024.
To join the grassroots efforts in pursuing election integrity and audits of the 2020 election in Georgia, you can join the following groups on Telegram:
- GAelectionauditchat
- Kandiss Taylor (candidate for Governor)
- Preserve GA Rights (Website)
- VoterGA.org (Website)
For other states, see our Full List of Telegram Channels.
ElectionFraud20.org and Seth Keshel have no affiliation with nor any responsibility for these channels. Discern carefully, as some users and even admins of channels have shown obstruction to transparent audits of our elections.