To get an introductory overview of Draza’s work and process, visit our page on Draza Smith’s Election Analysis.
The following was originally posted by Draza Smith on Telegram, September 2021, starting from this post. Reproduced here for easier reading.
A Look Back at 2020
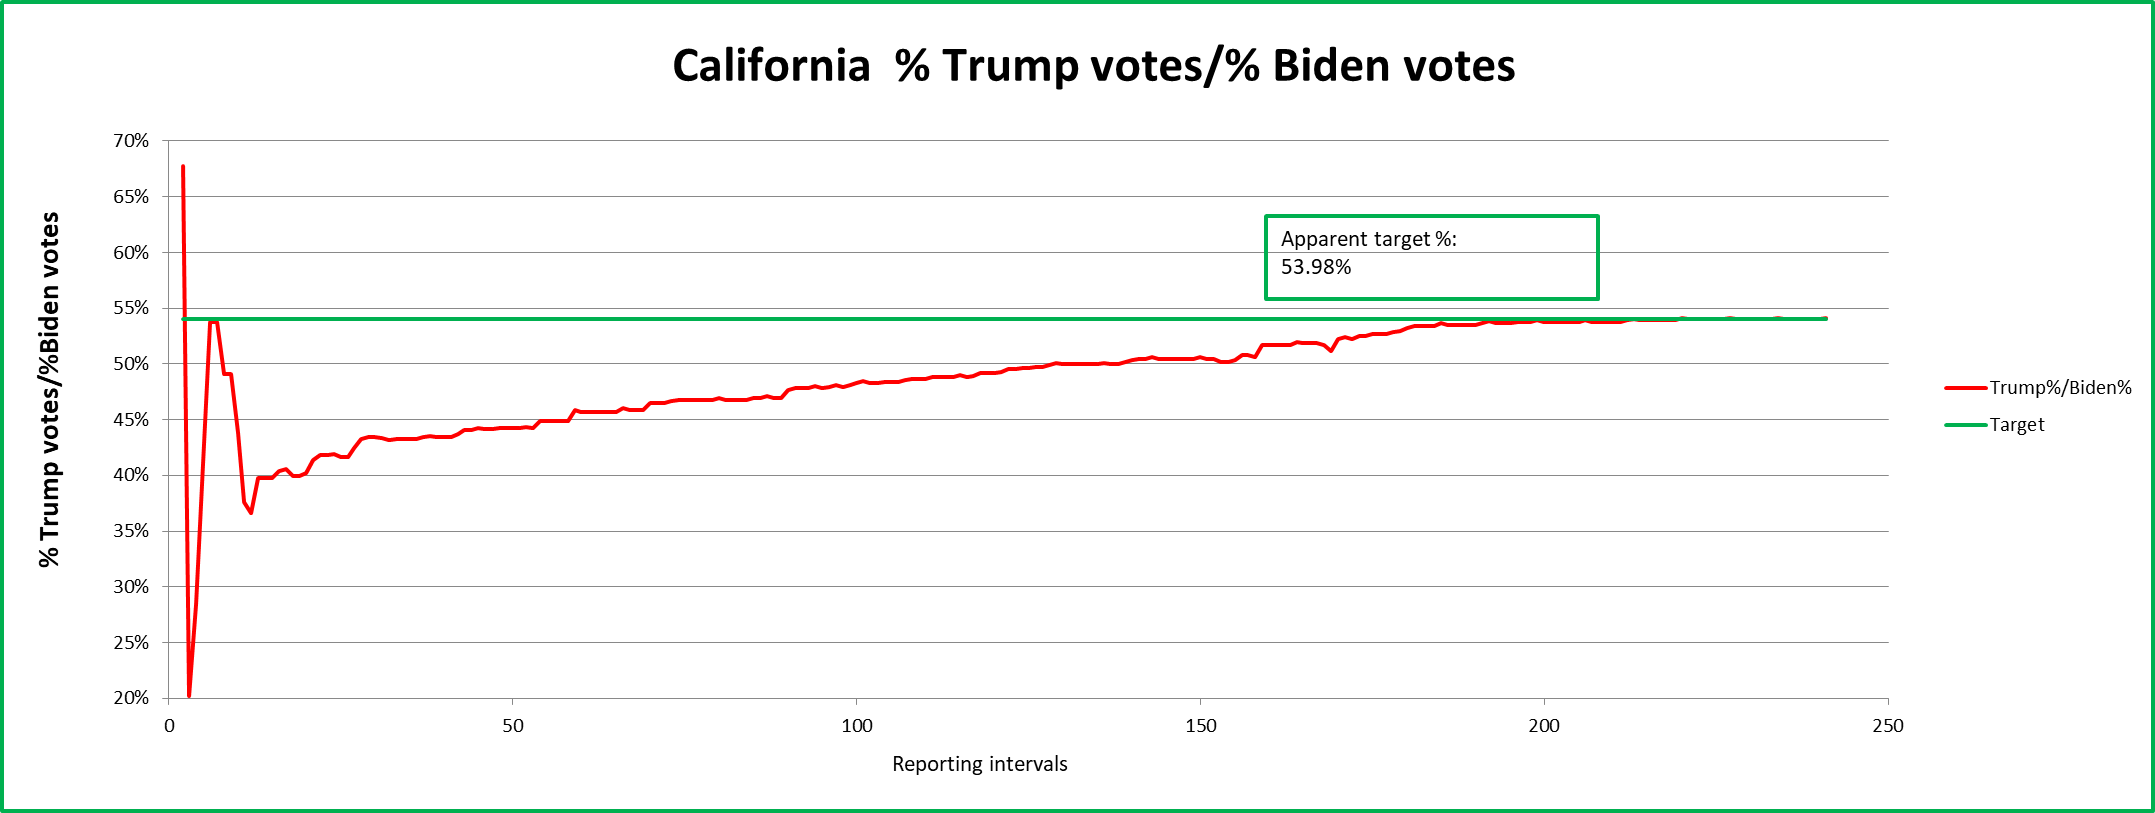
Just a trip down memory lane — the last time we saw an election in California. There is the trend of Trump/Biden votes over time — this will now be the Yes/No votes over time.
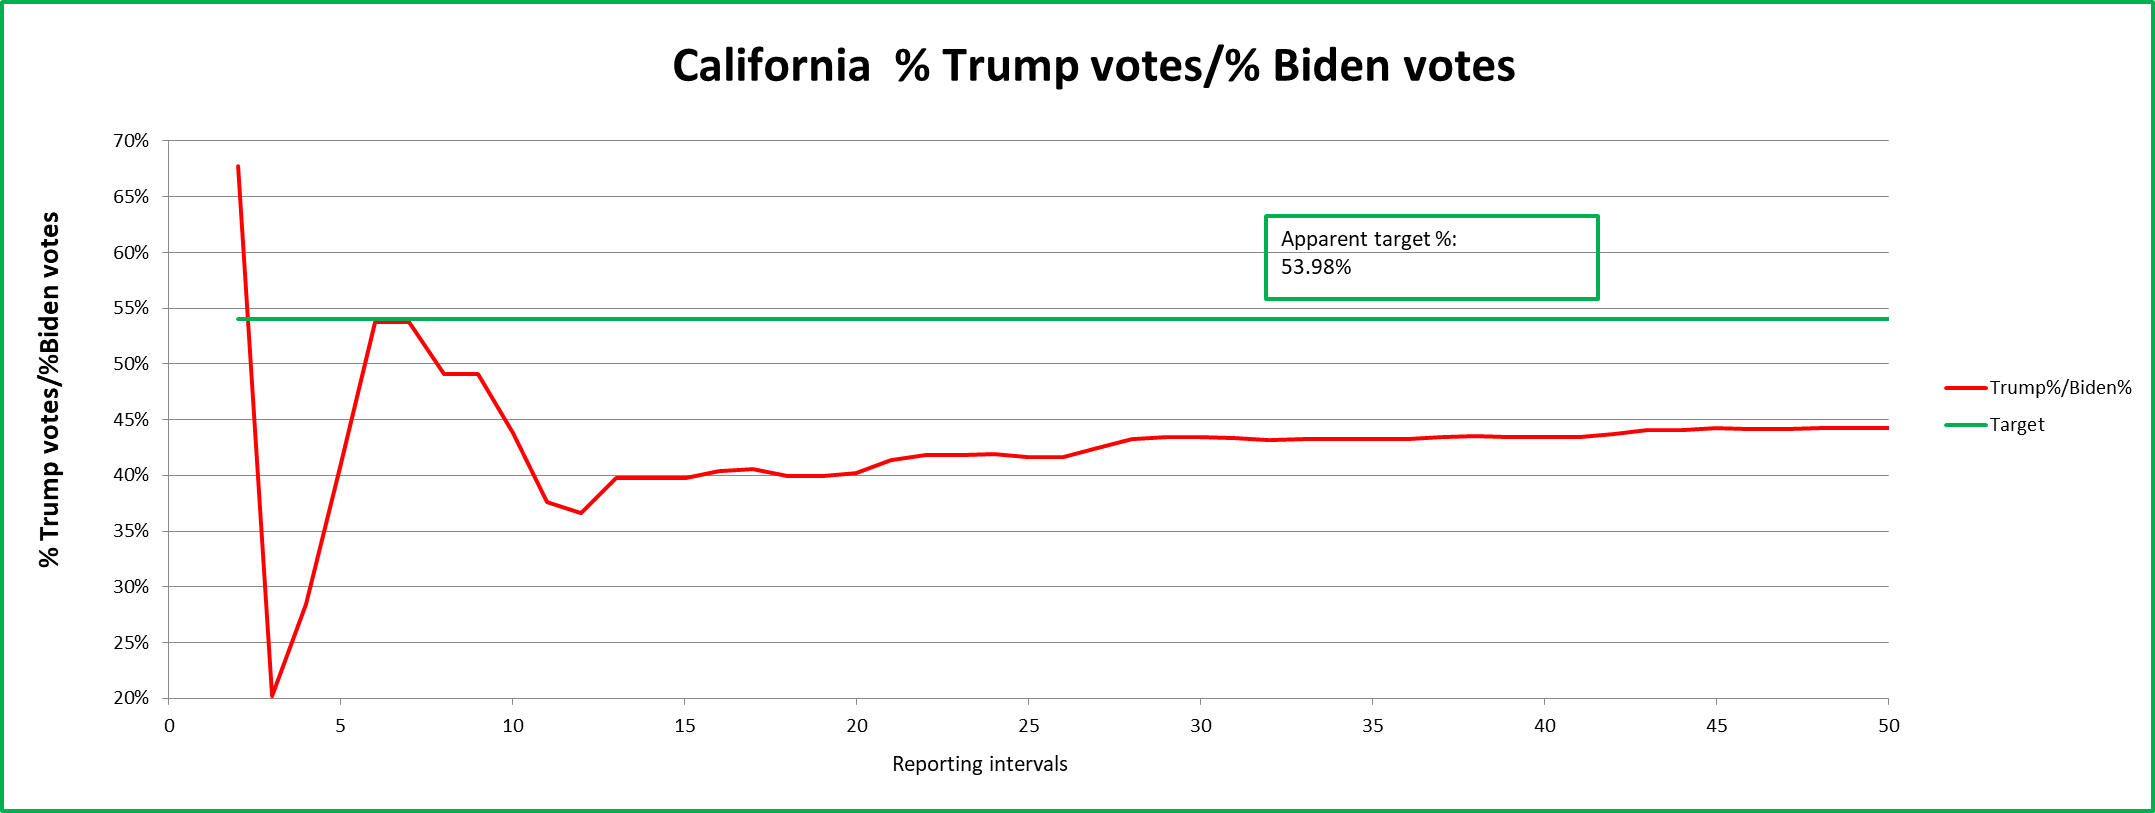
Above is a closer look at the beginning of the counting — over time — we have the drop and then the shark-tooth and the hill. After this in initial setup — we settle into a percentage of about 40% or 2/5ths Trump to Biden votes. Look out of this trend of the initial push to setup with with 2/5 ratio of the Yes/No votes that will then rise over time to our setpoint. CA had a setpoint before of 1:2 Trump to Biden votes. I don’t see why they would want to make Newsom less popular then Biden…so maybe our final ratio will again be close to 1:2?
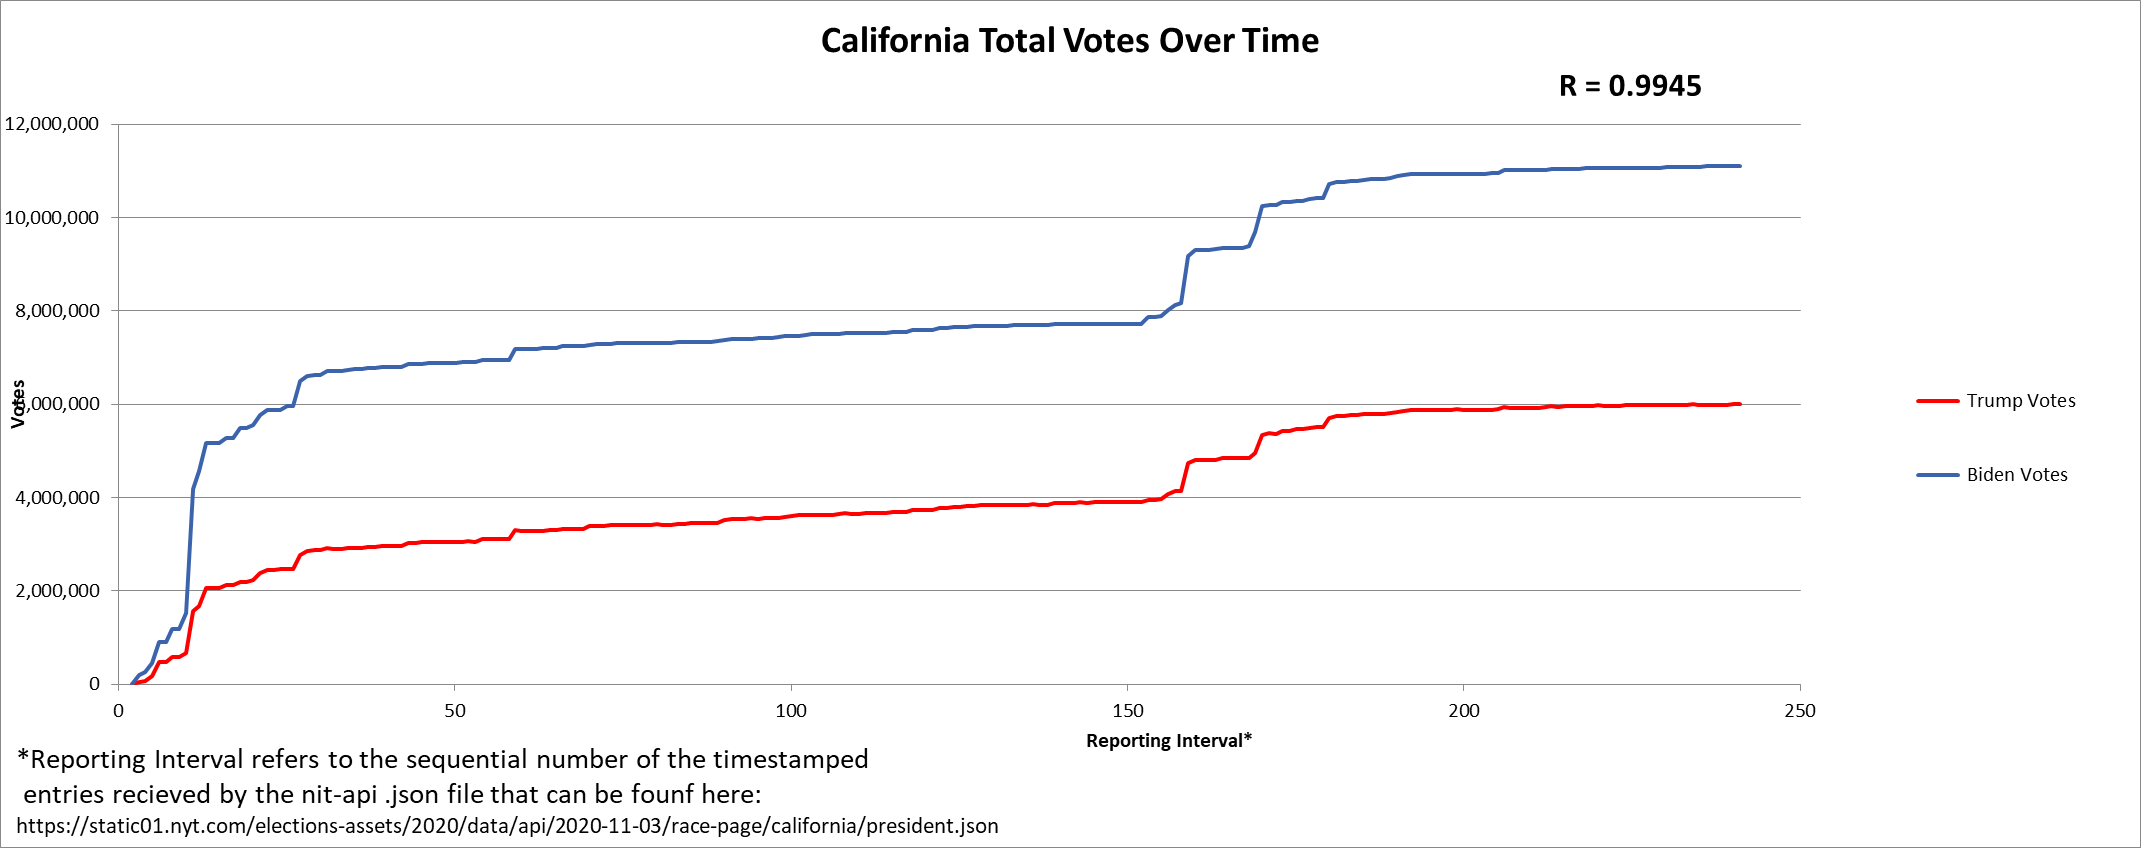
And — the votes over time between the two had an AMAZING correlation! The Democratic and Republican voters in CA vote in unison to keep that PERFECT ratio control. You guys are amazing. 🤪
So… yesterday I showed the overall state ratio curve for CA. Well, it looks like they used one of the curves that they use when they REALLY need to guarantee that their unpopular candidate gets in. Wanna make bets on if Newsom’s curve matches Pelosi’s or Schiff’s from last year?
2021 Governor Recall Election
A wonderful person captured data for me during the election on an automated manner that is far better than I could have done! They captured quite a bit of the county data, as well, from the Scytl/ClarityElections websites. However, I have a good bit of parsing to do before I can evaluate the whole race. The other plots I have seen look very familiar, as far as the initial system perturbation and rise to a setpoint. Expectation is that the count will take a few more days and will flatten off to our final setpoint, with the last entries reducing the overall vote count, while not changing the final setpoint. But! I have looked over the first couple of counties…
Alameda County
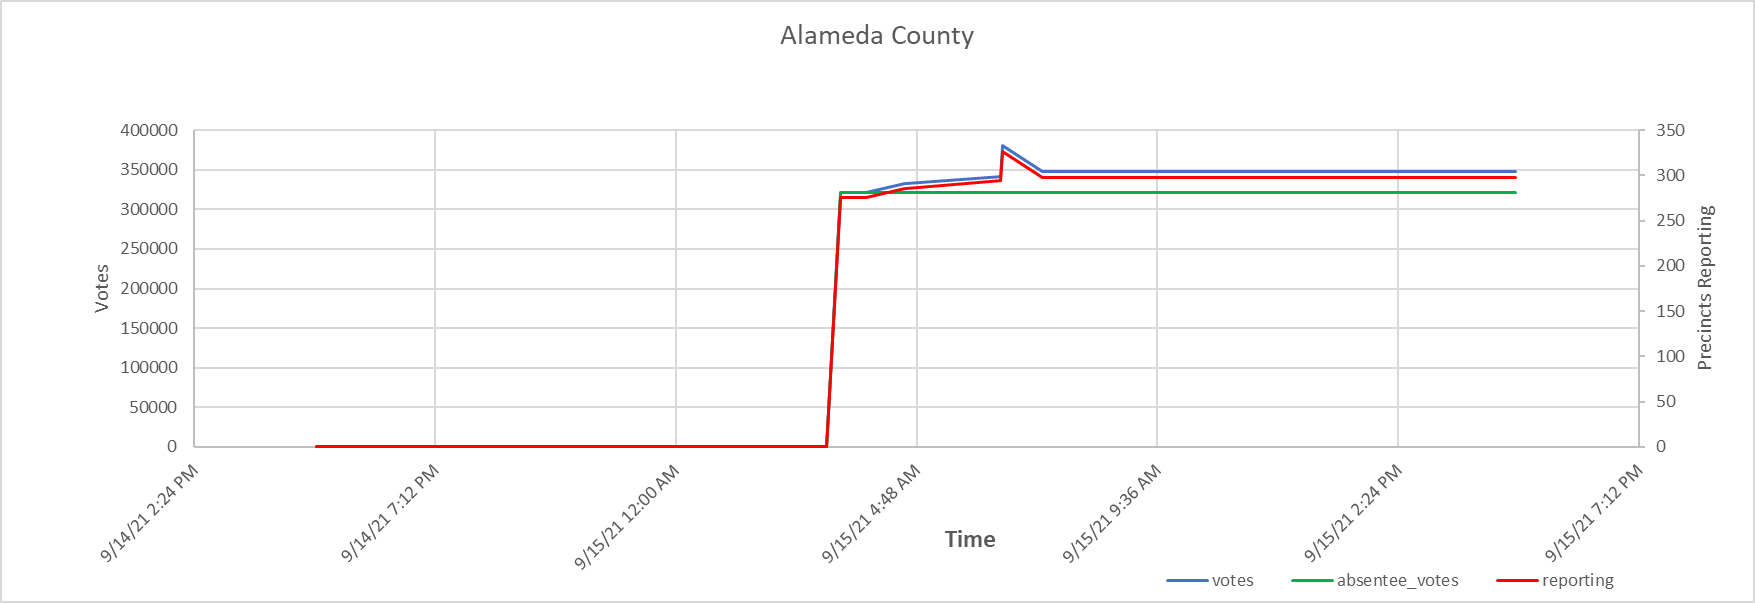
What were they doing in Alameda County, CA!? They are waiting to get out first votes and then they do… and then all of a sudden they get 32 additional precincts reporting! But – oops – didn’t mean it… they take 28 of them out on the next reporting interval.
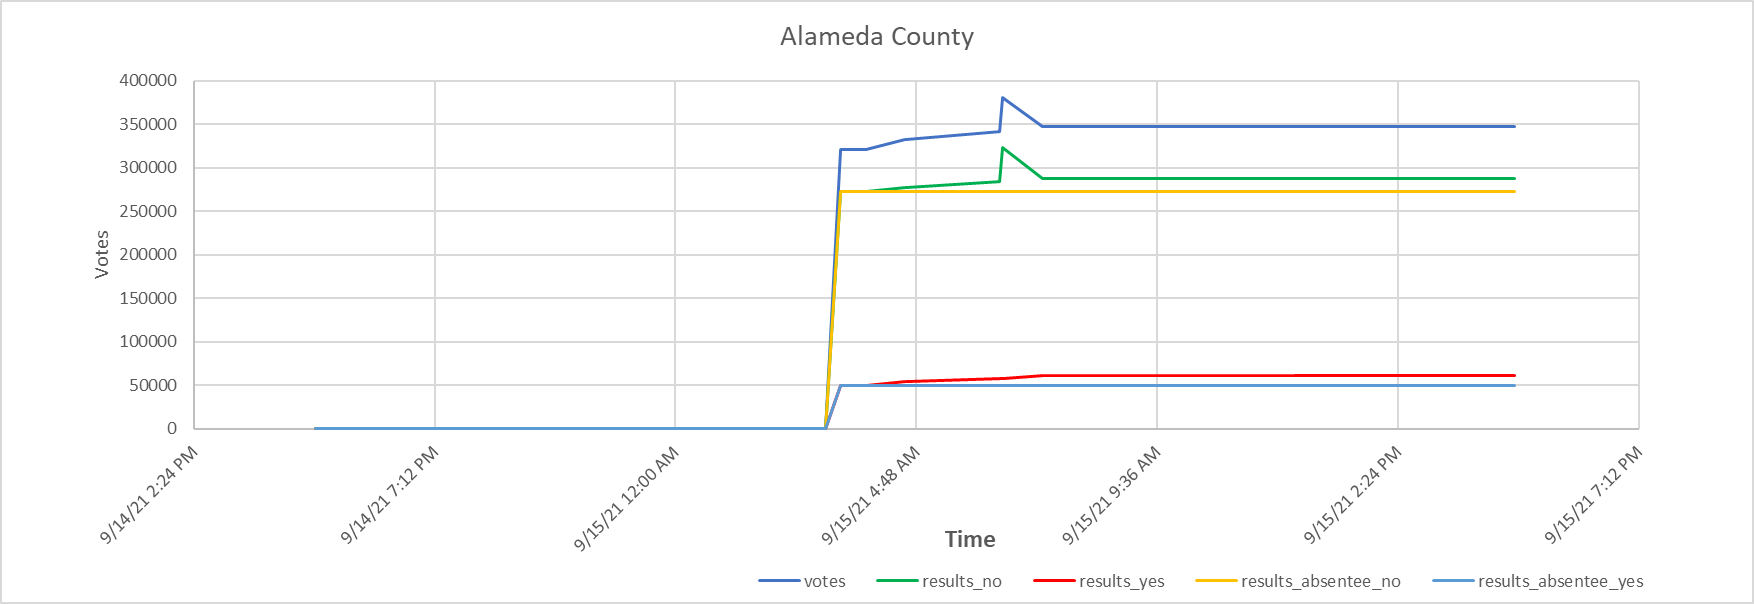
So what went on here? We had 32 precincts report with a very surprising vote tally. All 32 counties that reported ONLY reported with IN-PERSON “NO” votes. Amazing! Really amazing! Not a single dissenter and not a single person wanted the convenience of voting by mail.
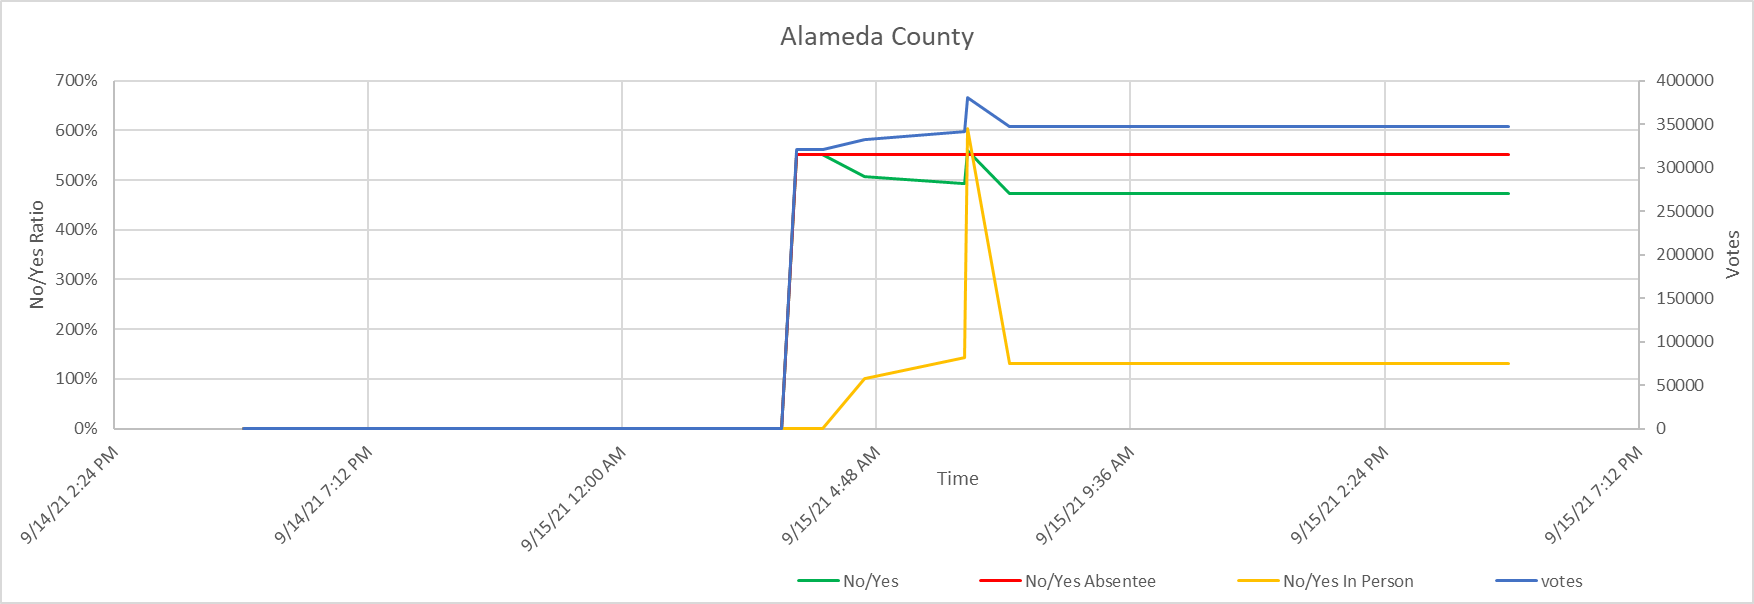
So — here we see that caused a HUGE push in the NO/YES ratio — apparently a little correction had to be made. Let’s remove 28 of those precincts. So — when we added the 32 — we added 38,673 votes to the in-person NO votes. Next count, we remove 28 precincts and remove 35,630 of the in-person NO votes, this still leaves 3043 of those mysterious NO votes. But, during this correction — we also add a few in-person YES votes. Wanna guess how many? Yep, 3084. Alameda must be a magical place.
I am not sure I understand those numbers quite yet — but — 3,084 is an increase of almost exactly 5% (5.08%) of the total YES votes that currently were cast. The 3,043 was almost exactly 1% (1.06%) of the current NO votes that had been cast. By raising both columns by almost the same amount, this decreases the apparent NO/YES overall ratio. This is like if you ask for a vote, and 10 people vote and the vote is 7 to 3 — there is an OBVIOUS preference for one candidate over the other. Then if you add 10 phantom voters to both sides, now the vote is 17:13. The winner still wins by 4 votes, but it looks like much closer of a race. In this case, this type of a move in Alameda county reduced the NO/YES ratio from 142% to 130%, or a 12% adjustment by adding to both sides.
Alpine County
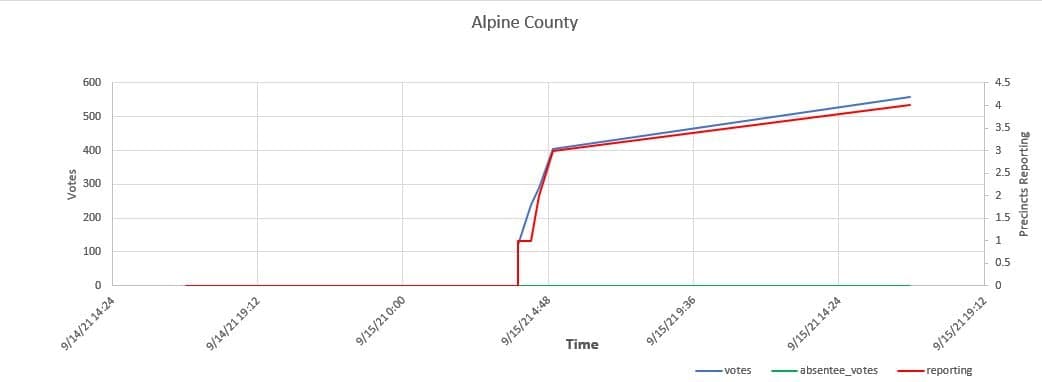
Alpine County, CA apparently has a little magic, too, but not quite as much as Alameda. Here — what Alpine does that is magical is that they increase votes — both YES and NO without a single new precinct reporting! Amazing. The increase that happens when there are no new precincts reporting almost exactly doubles the total vote and ever so slightly increases that NO percentage ratio.
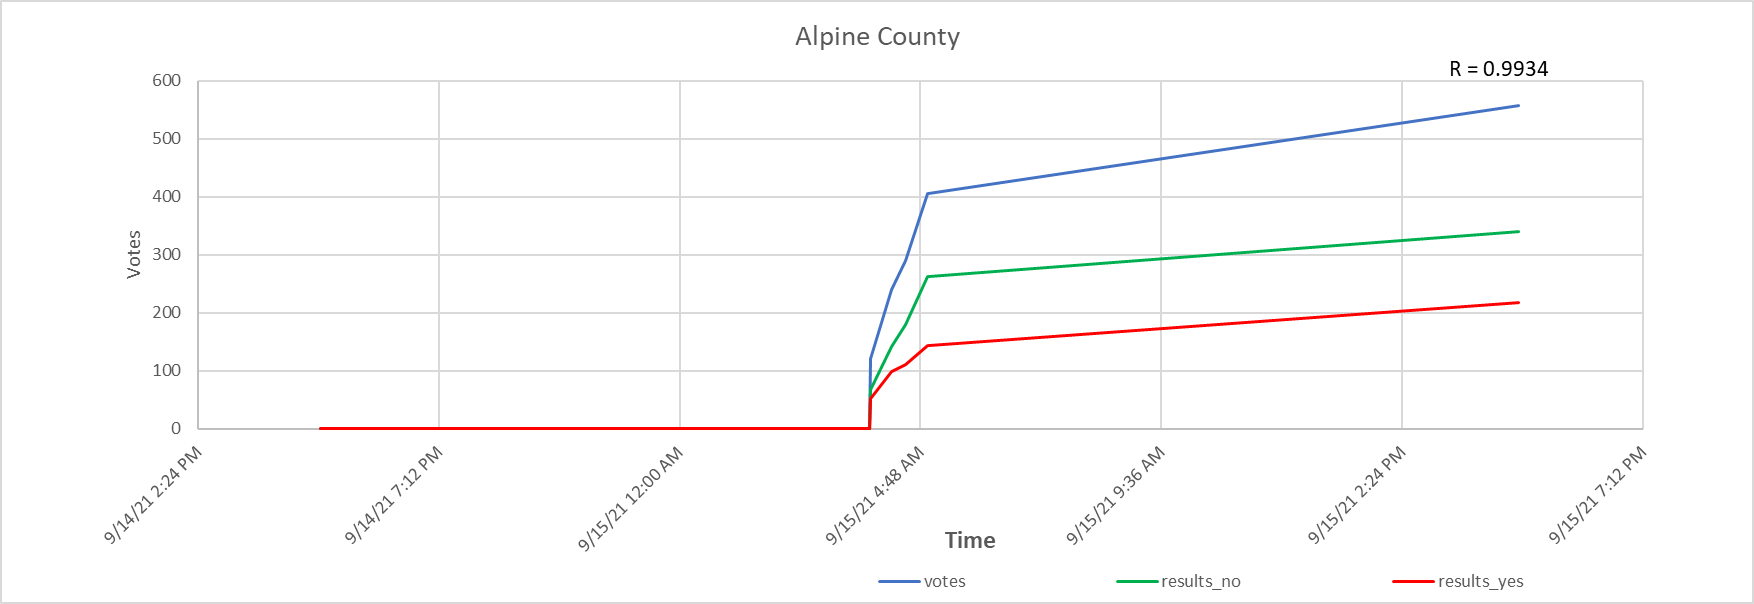
But — they are well coordinated in Alpine county. The NO and YES votes come in with an almost perfect correlation with an R value of 0.9934.
Orange County
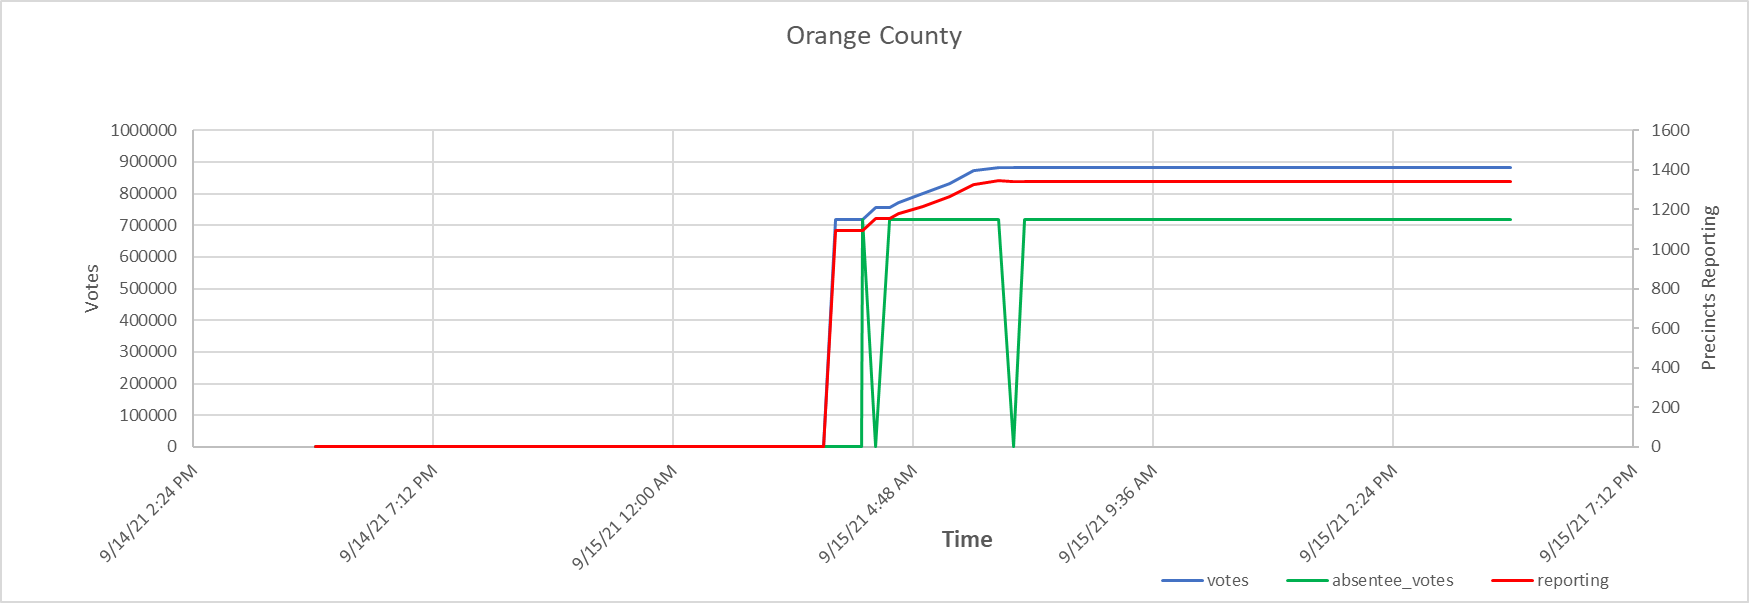
I saw some chatter about it not being very believable that the Orange County votes that were reported were actually the Orange County votes that were cast by the people of Orange County. Looks like that claim might have some teeth! I mean — other than the vampire teeth that appear on the plot of the mail-in ballot voters there.
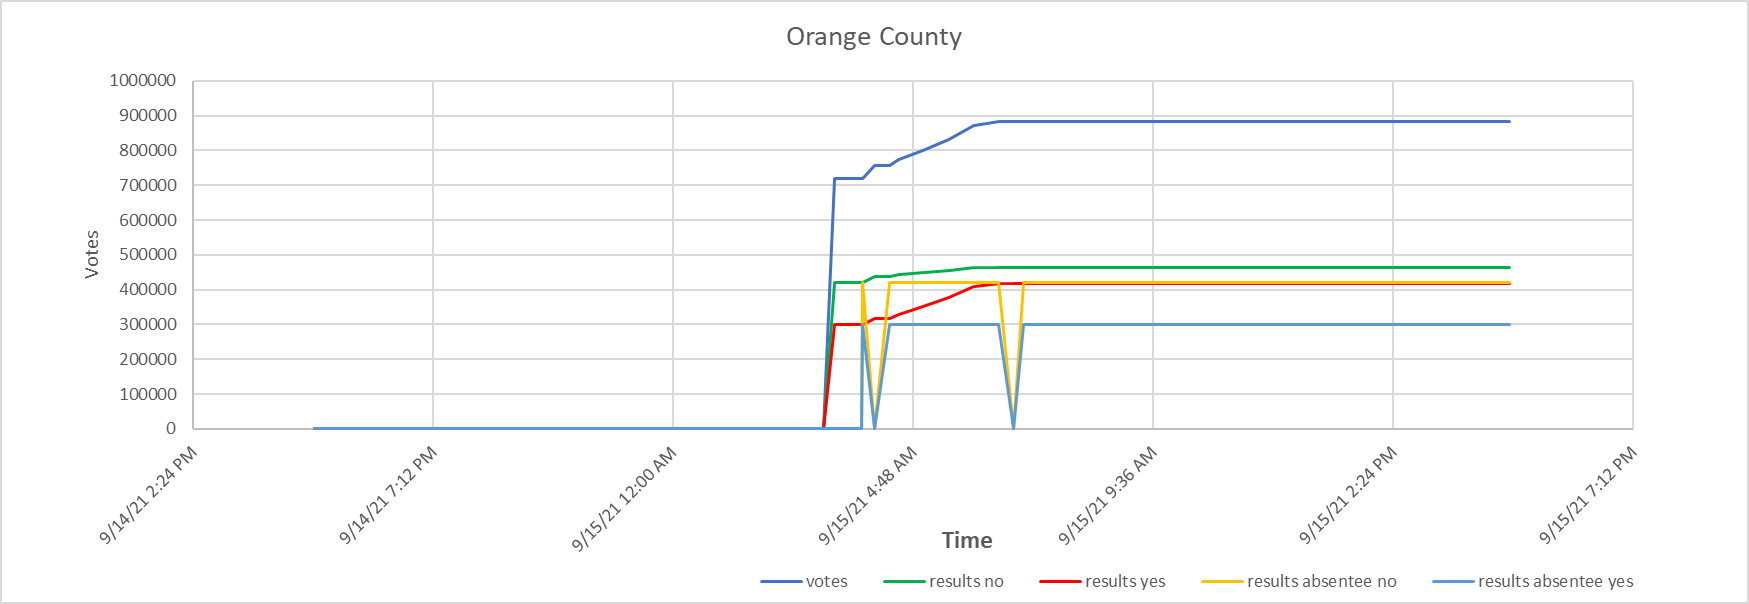
So — it really looks like there were 464,164 NO votes and 299,711 YES votes that should have been reported as mail-in ballots on the 3rd reporting interval. But, they all don’t show up as mail-in votes until the 6th. And then there are no reported mail-in ballots (YES or NO) on the 7th — but they are back on the 8th only to disappear again on the 14th to come back again on the 15th. So — even though they cant keep track of the mail-in ballot numbers, at least they aren’t changed when they find them again.
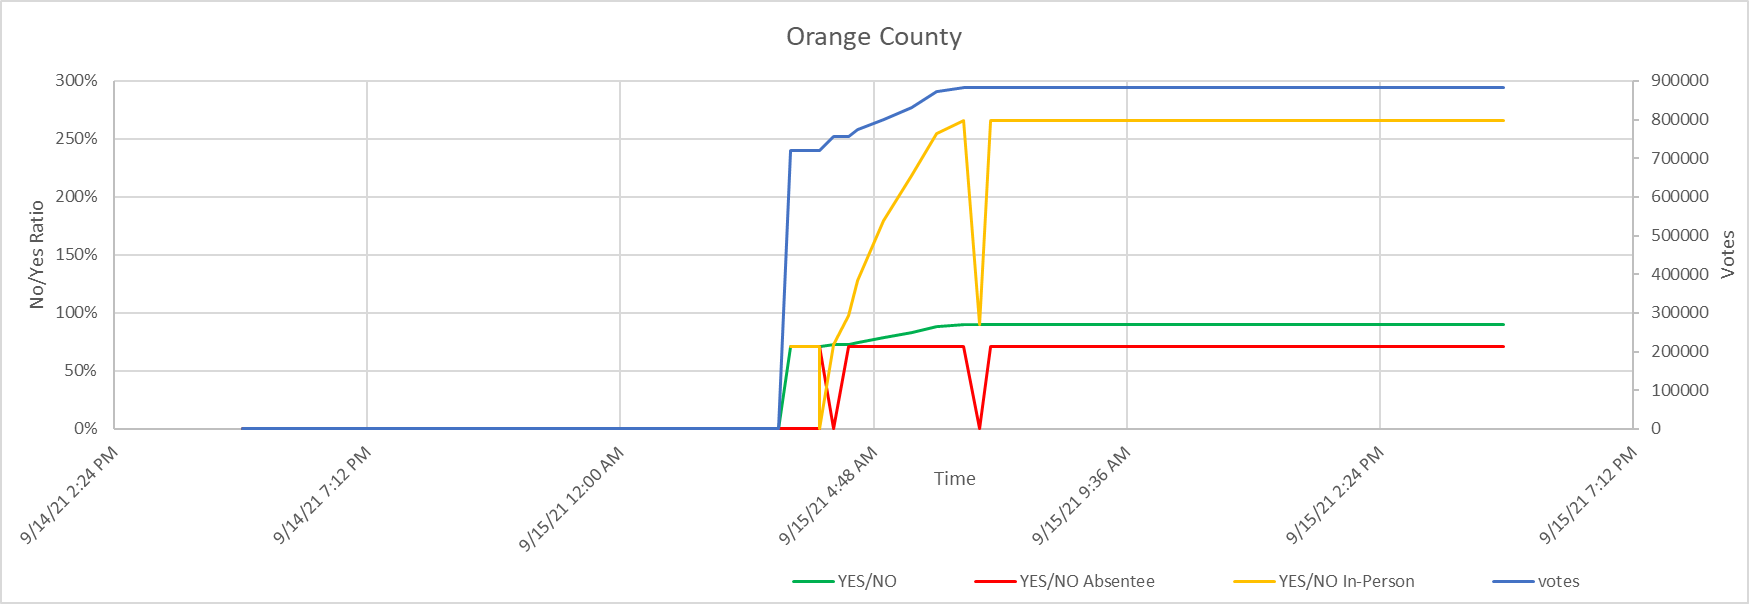
But — here is the real story, I think. That yellow line there. If you ignore the dip (which is probably the mail-in votes strangely not being reported as mail-in votes for an interval or two) and you look at the overall curve of the in-person votes, there are almost 3 residents of Orange County voting in-person to remove Newsom for each 1 person saying he can stay.
If any of these numbers are looking odd to you, remember this link, where you can go check the status of your vote-by-mail or provisional ballot. Might be interesting for those people that voted in person to verify that. https://voterstatus.sos.ca.gov
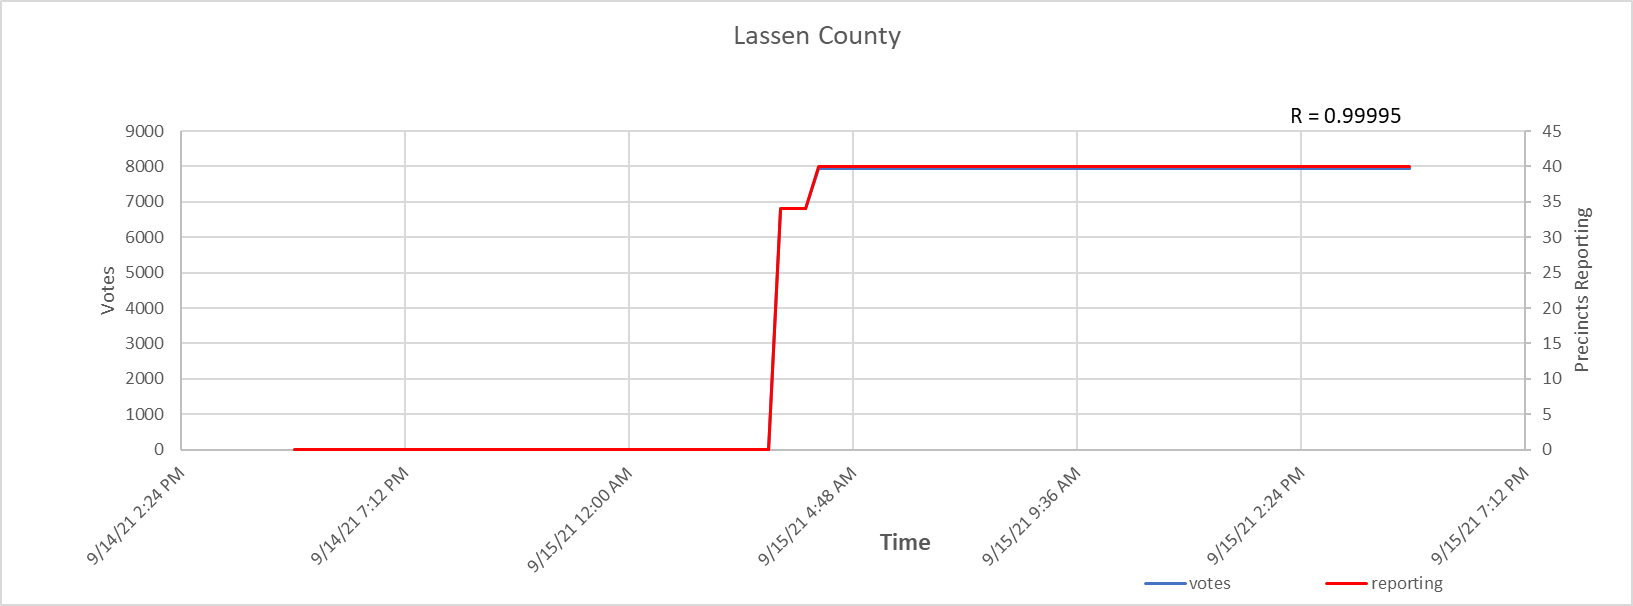
So CA has a LOT of counties! I am seeing some very interesting things in most of the counties that I have looked at — but I have a LOT more to go! There is a very odd correlation between the number of votes over time and the number of precincts that are reporting over time. Those are some crazy high correlation numbers
Lassen County
Stanislaus County
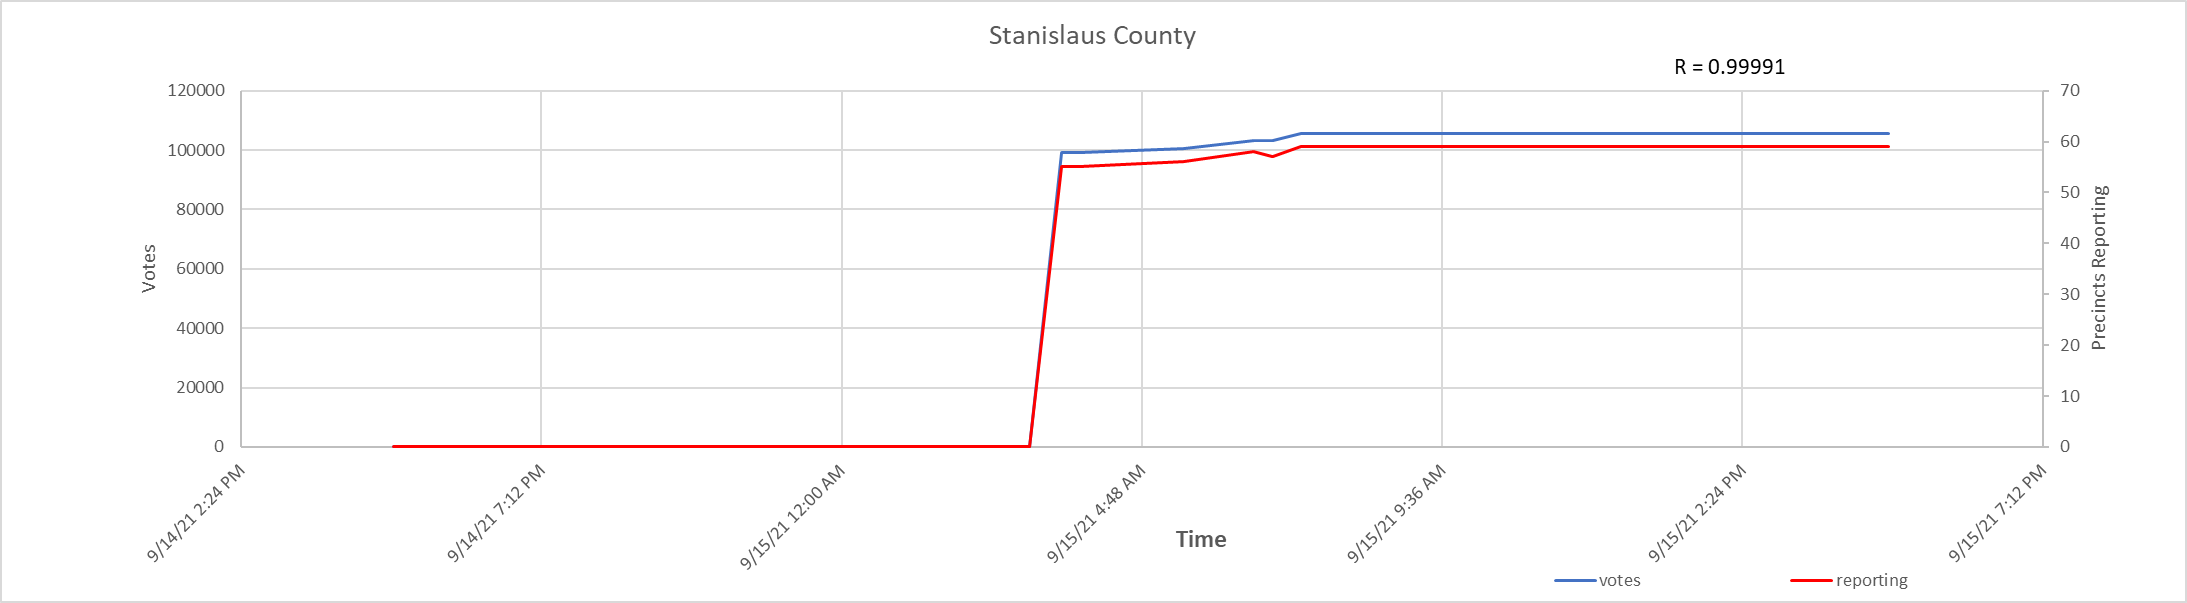
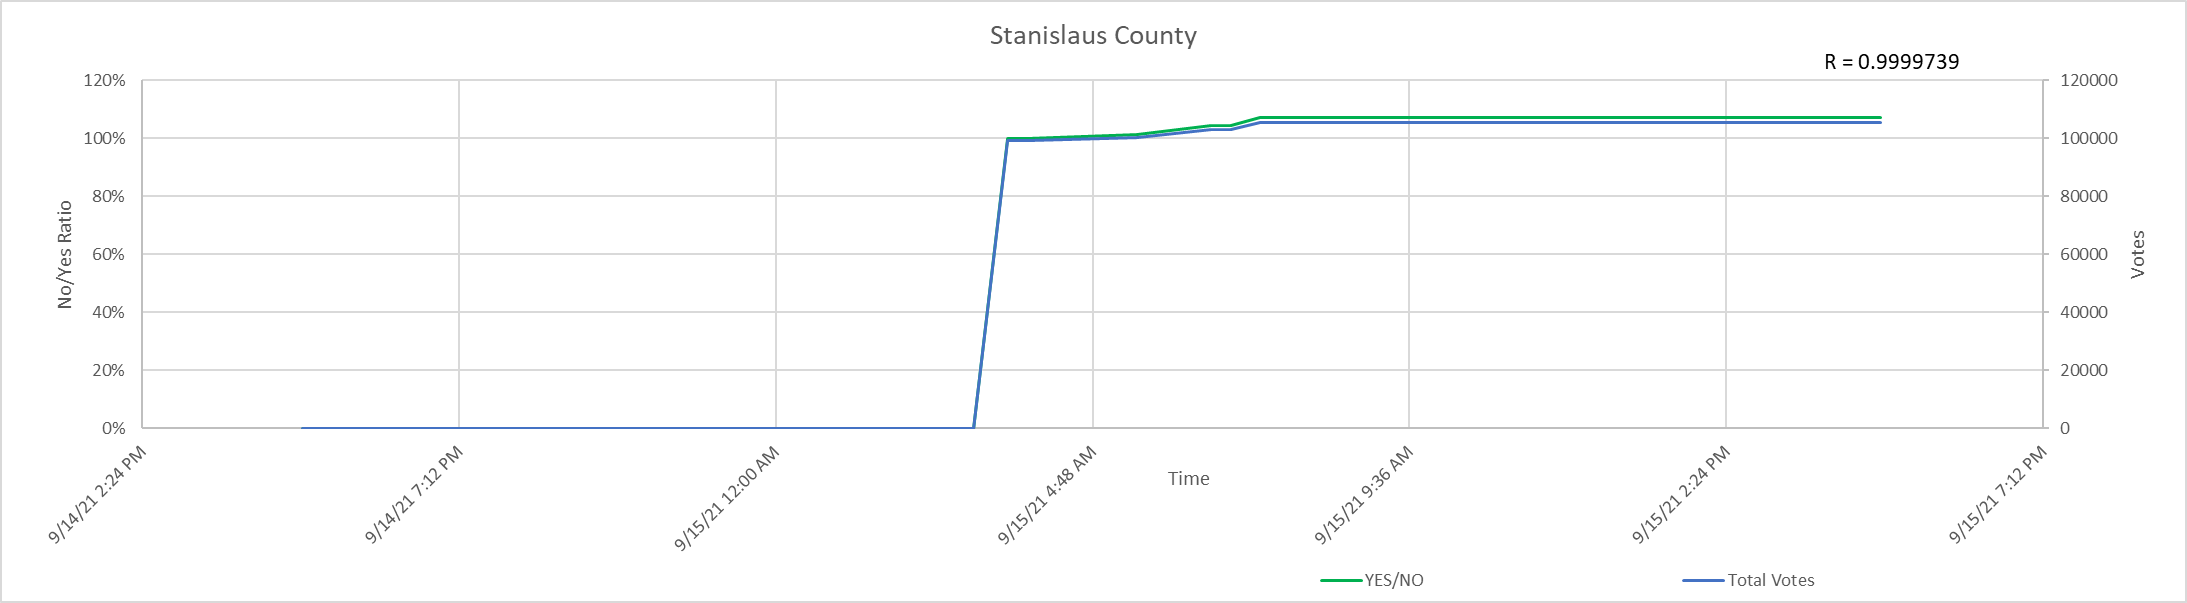
Followed by a crazy high correlation between the YES/NO ratio and the number of votes
Some Statewide Patterns
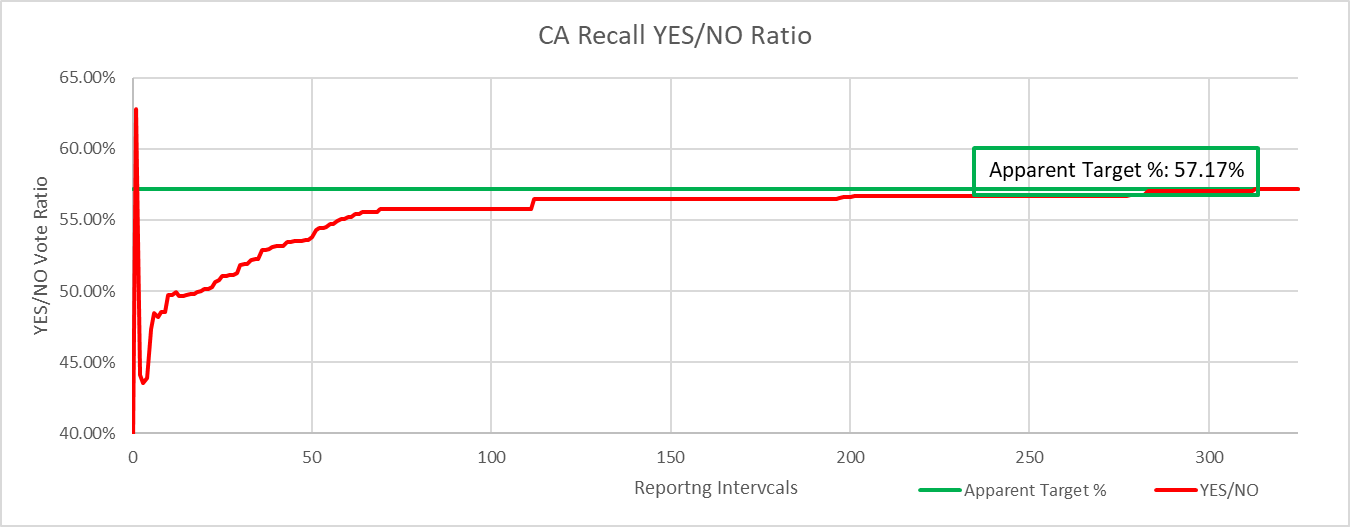
Anyone surprised by the shape of this curve?
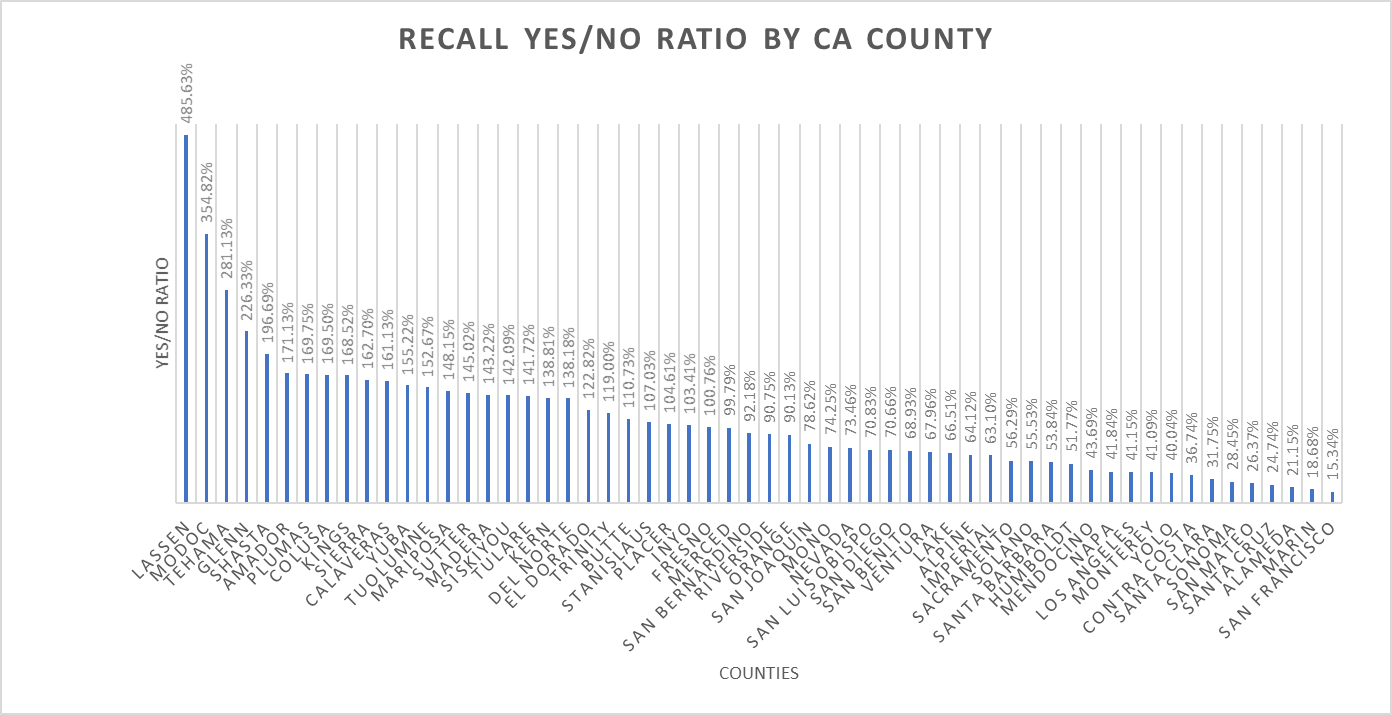
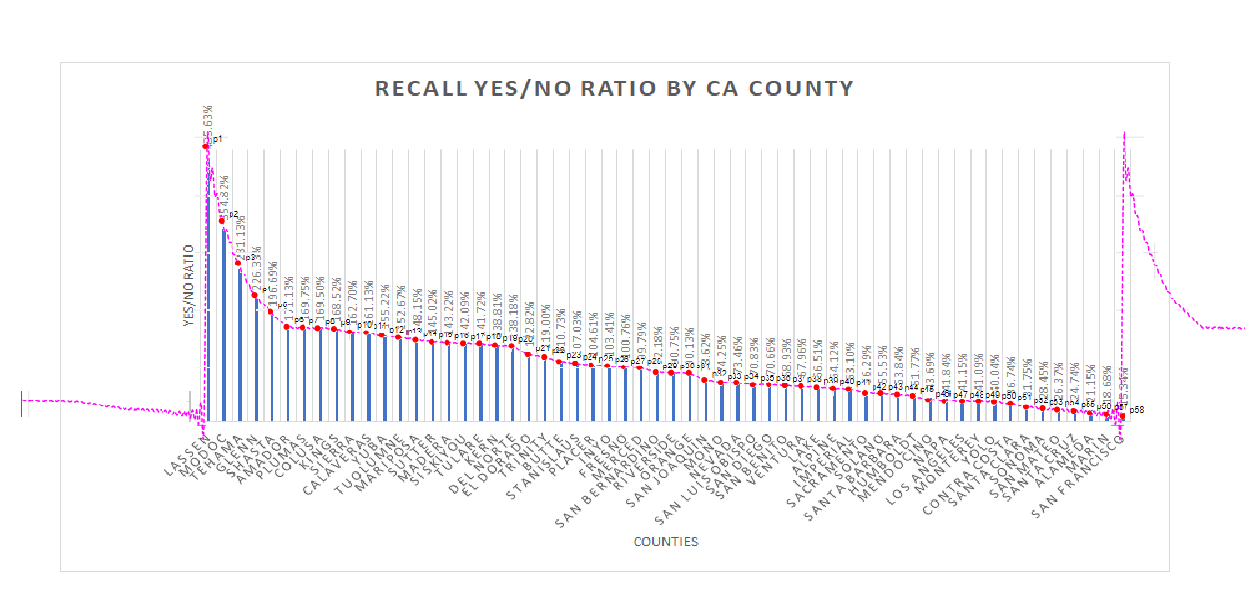
Here are the final ratios of each of the CA counties as the “votes” were reported in the Recall election.
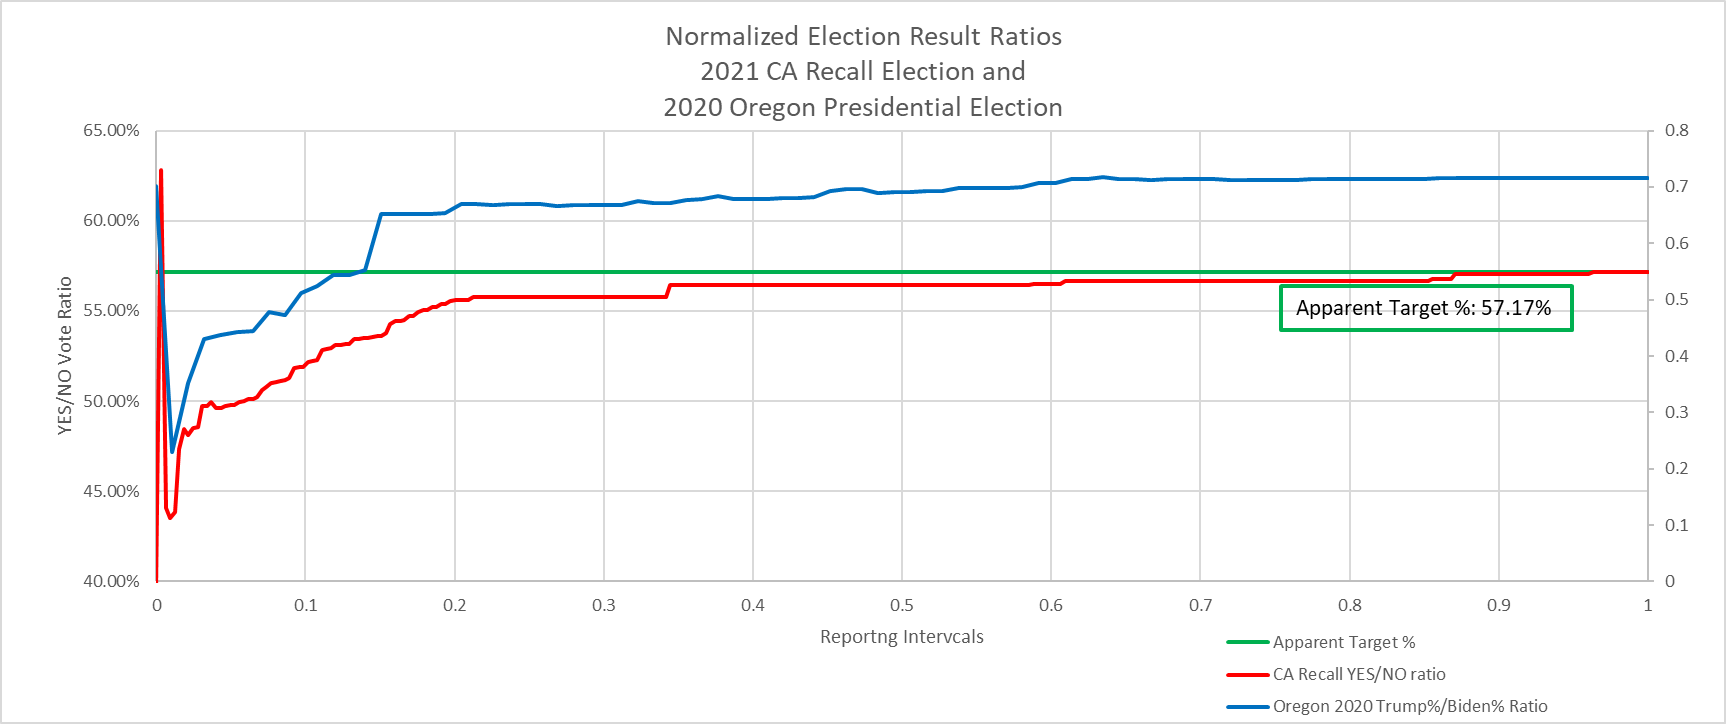
So — here is the normalized plot of the CA Recall Election ratio of YES/NO votes that happened 9/14/2021. Also plotted is the Presidential Election ratio of %Trump/%Biden votes that happened on 11/3/2020.
The difference in fidelity of the plots most likely comes from the fact that the Oregon plot only has 50 points, but the CA Recall election has 325.
Here is the CA Recall Election County ratios again with a Fourier Series curve superimposed. This is a calculated function. Trying to decide if I am fooling myself with this one. I suppose you could define a lot of curves with a Fourier Series — just trying to figure out what the rationale would be if this was the intentional starting point curve to pre-define these output ratio setpoints.
Vote Correction
So — I was looking through the CA Recall data and I was looking for the part of the story where we lost over 300k votes, as shown on CNN. I cannot find it. What I can find is one place during the count where the overall totals did reduce, but it was not anywhere near 100k.
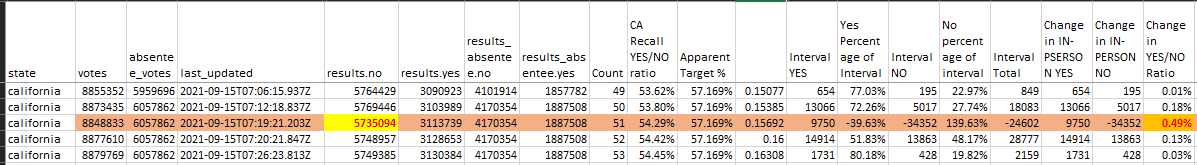
What we do see here is that the total votes were reduced by around 24.6k. Funny thing though — none of the mail-in votes were “adjusted”. The in-person votes were changed and they reduced the NO votes by 35k and increased the YES votes by around 10k. This little fancy maneuver adjusted the overall total vote ratio by almost exactly 0.5%.
Anybody following along, we have seen in the 2020 election data that there was apparent modulation of the overall vote ratio by manipulation of multiples of 0.1% of the overall total vote within the interval vote. I guess that is still a thing.
More to come…
As Draza releases further analysis, we will aim to post it here.
In the meantime, you can keep up-to-date on Telegram via @ladydraza and @ElectionFraud20_org.
Raw Data
The raw CA Recall timeseries data can be downloaded from the link below.
https://github.com/giovannivz/california-recall-data-2021/tree/master/NYT
Draza intends on sharing her cleaned-up data after she finishes her evaluation of all the counties, where she has filtered out duplicates. We’ll post that information here once we have it.
The latest New York Times version of the recall election results is also available from this URL in JSON format, however it does not contain the time-series data with the batch counts over time, only the current/latest results.
https://static01.nyt.com/elections-assets/2020/data/api/2021-09-14/state-page/california.json