See also the main article on North Carolina, for documented election integrity issues and further reports.
The following charts show Dr. Doug Frank’s analysis of the 2020 election data in North Carolina. For an overview of Dr. Frank’s approach and findings, see the main page on Dr. Frank’s Election Analysis.
Using 2010 US Census data and updated 2019 American Community Survey data from the Census Bureau, Dr. Frank is able to predict not only the voter turnout by age, but voter registration by age. When Frank’s prediction is compared to the actual voter turnout and voter registration by age, it correlates to an unusually high level of accuracy.
Pay particular attention to items highlighted in red, below:
-
Counties where the percent of population registered to vote is higher than 95%. This may simply be poor administration in not removing old voters from the rolls, or it may provide some indication of counties where “phantom” voters were been added to the rolls for the purpose of submitting fraudulent votes. These deserve deeper investigation.
-
How accurately Dr. Frank was able to predict the voting turnout based on the census data and applying his algorithm (the “Predictability” column below, also known as the correlation coefficient). Very high numbers above 0.95 may indicate some form of algorithmic manipulation of votes.
Click a column heading to sort by that column.
| County | Registered Voters vs Residents Over Age 18 | % of Registered Voters Who Voted | Predictability |
|---|---|---|---|
| {{ row['County'] }} {{ row['County'] }} | {{ row['% Registered'] }} | {{ row['% Turnout'] }} | {{ row['Predictability'] }} |
| Average of All Counties | {{ (data.reduce((total, row) => total+parseFloat(row['% Registered']), 0) / data.length).toFixed(1) }}% | {{ (data.reduce((total, row) => total+parseFloat(row['% Turnout']), 0) / data.length).toFixed(1) }}% | {{ (data.reduce((total, row) => total+row['Predictability'], 0) / data.length).toFixed(3) }} |
Other points to note:
-
Sometimes the ballot count numbers and voter registration numbers used by Dr. Frank differ from other official sources. This appears to be because in these comparisons, Dr. Frank takes the number of voters from the state’s voter rolls (or “voter history file”) rather than the official number of votes. In a number of states these numbers do not reconcile accurately, an indicator of poorly administered voter rolls. See Dr. Frank’s mention of this issue, and take this into account with your comparisons.
-
Many states also demonstrate poor clean-up of their voter rolls, where voters that have died or moved interstate are left on the rolls for extended periods of time. This might explain some of the high numbers of registered voters vs residents, including instances where this is over 100%. Although it appears fraudulent at first glance, some of this might simply be poor administration. It definitely deserves a deeper look, however.
Charts For Each County
Bloated Voter Rolls
Dr. Doug Frank performed voter registration analysis and found that North Carolina had more people registered to vote than the total population over age 18.
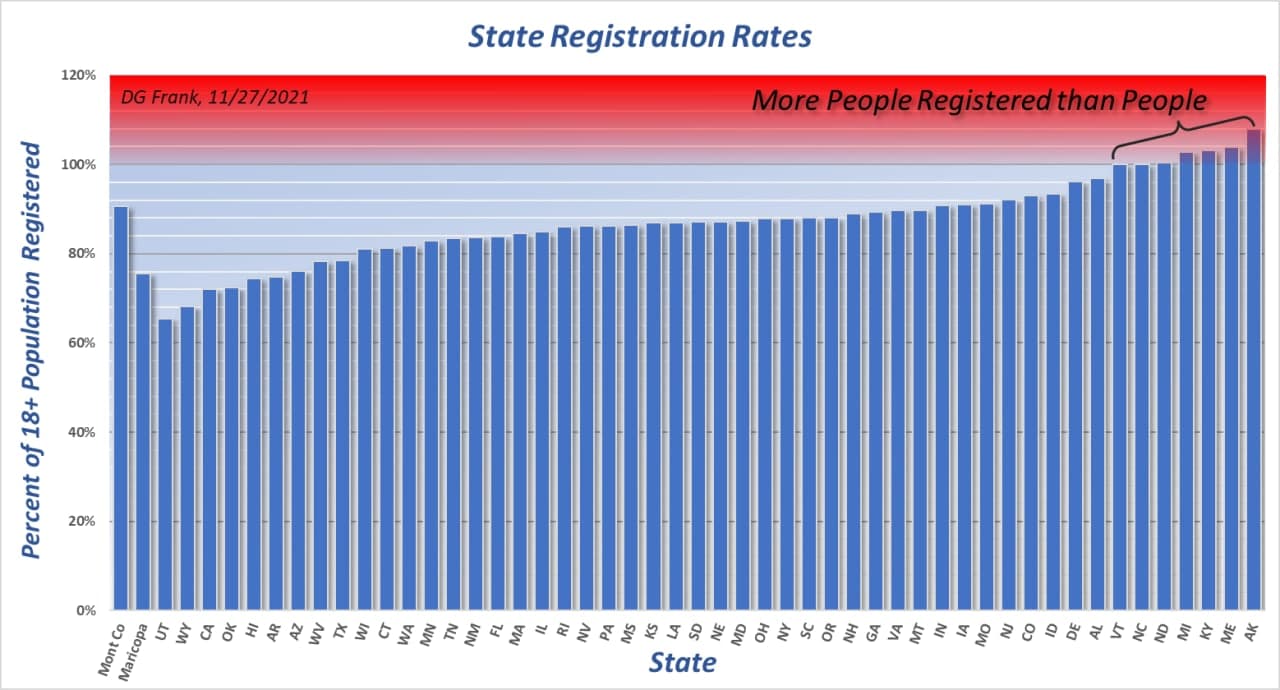
Source: Telegram Post, Nov 28, 2021
While this could be a symptom of poor clean-up of voter rolls — where voters that have died or moved interstate are left on the rolls for extended periods of time — it creates significant opportunity for fraudulent ballots to be submitted under the names of expired voters, making them appear legitimate. This was made even easier with the prevalence of mail-in ballots and widespread abandonment of voter ID rules which occurred in many states during the 2020 election.
The door-to-door canvassing across numerous states is proving that “phantom votes” were indeed counted for certain voters who were registered but did not themselves submit a ballot.
Research is also underway to explore disconcerting cases in some states whereby voter rolls appear to have been deliberately padded with false, duplicated, or expired records, possibly for the purpose of providing cover for fraudulent ballots. This is evidenced by graphing the changes to voter rolls over time and observing patterns which appear algorithmically-generated rather than organic, and then drilling down to identify specific anomalous records. We hope to release more findings on these anomalies in the coming weeks.
Voter Registration & Turnout Compared to Other States
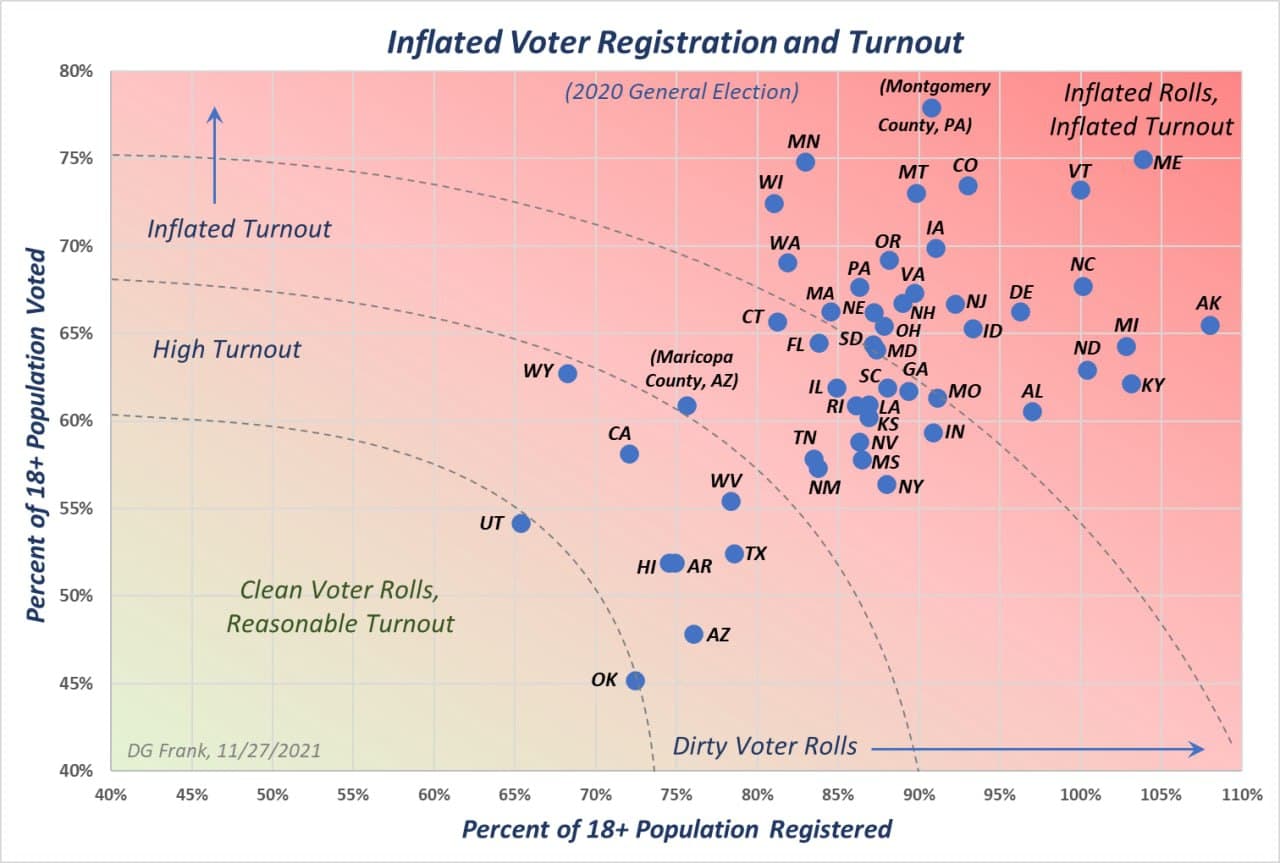
Source: Telegram Post, Nov 28, 2021