Introductory material sourced from Montana Election Integrity Project.
Dr. Douglas G. Frank is a 40-year modeler of pandemics and elections, a renowned scientist, and inventor who received his PhD in Electrochemistry at UC Santa Barbara. He has authored approximately sixty peer-reviewed scientific reports, including feature and cover articles in the leading scientific journals in the world (Science, Nature, Naturwissenschaften).
Dr. Frank built upon Kurt Hyde’s theory from 2010 that suggested that US Census data could be used to artificially inflate voter registration databases across the country. He further asserted that voter registration databases were indeed inflated during the 2020 General Election and that, using an algorithm that he theorizes was developed at the state level and applied to the voter registration information in each individual county in a state, the voter turnout of the election was predictable to an unusually high level of accuracy.
Using 2010 US Census data and updated 2019 American Community Survey data from the Census Bureau, Dr. Frank is able to predict not only the voter turnout by age, but voter registration by age. When Frank’s prediction is compared to the actual voter turnout and voter registration by age, it correlates to an unusually high level of accuracy. In the case of Missoula County, and most other of the 55 other counties in Montana, his prediction was correlative to 0.99.
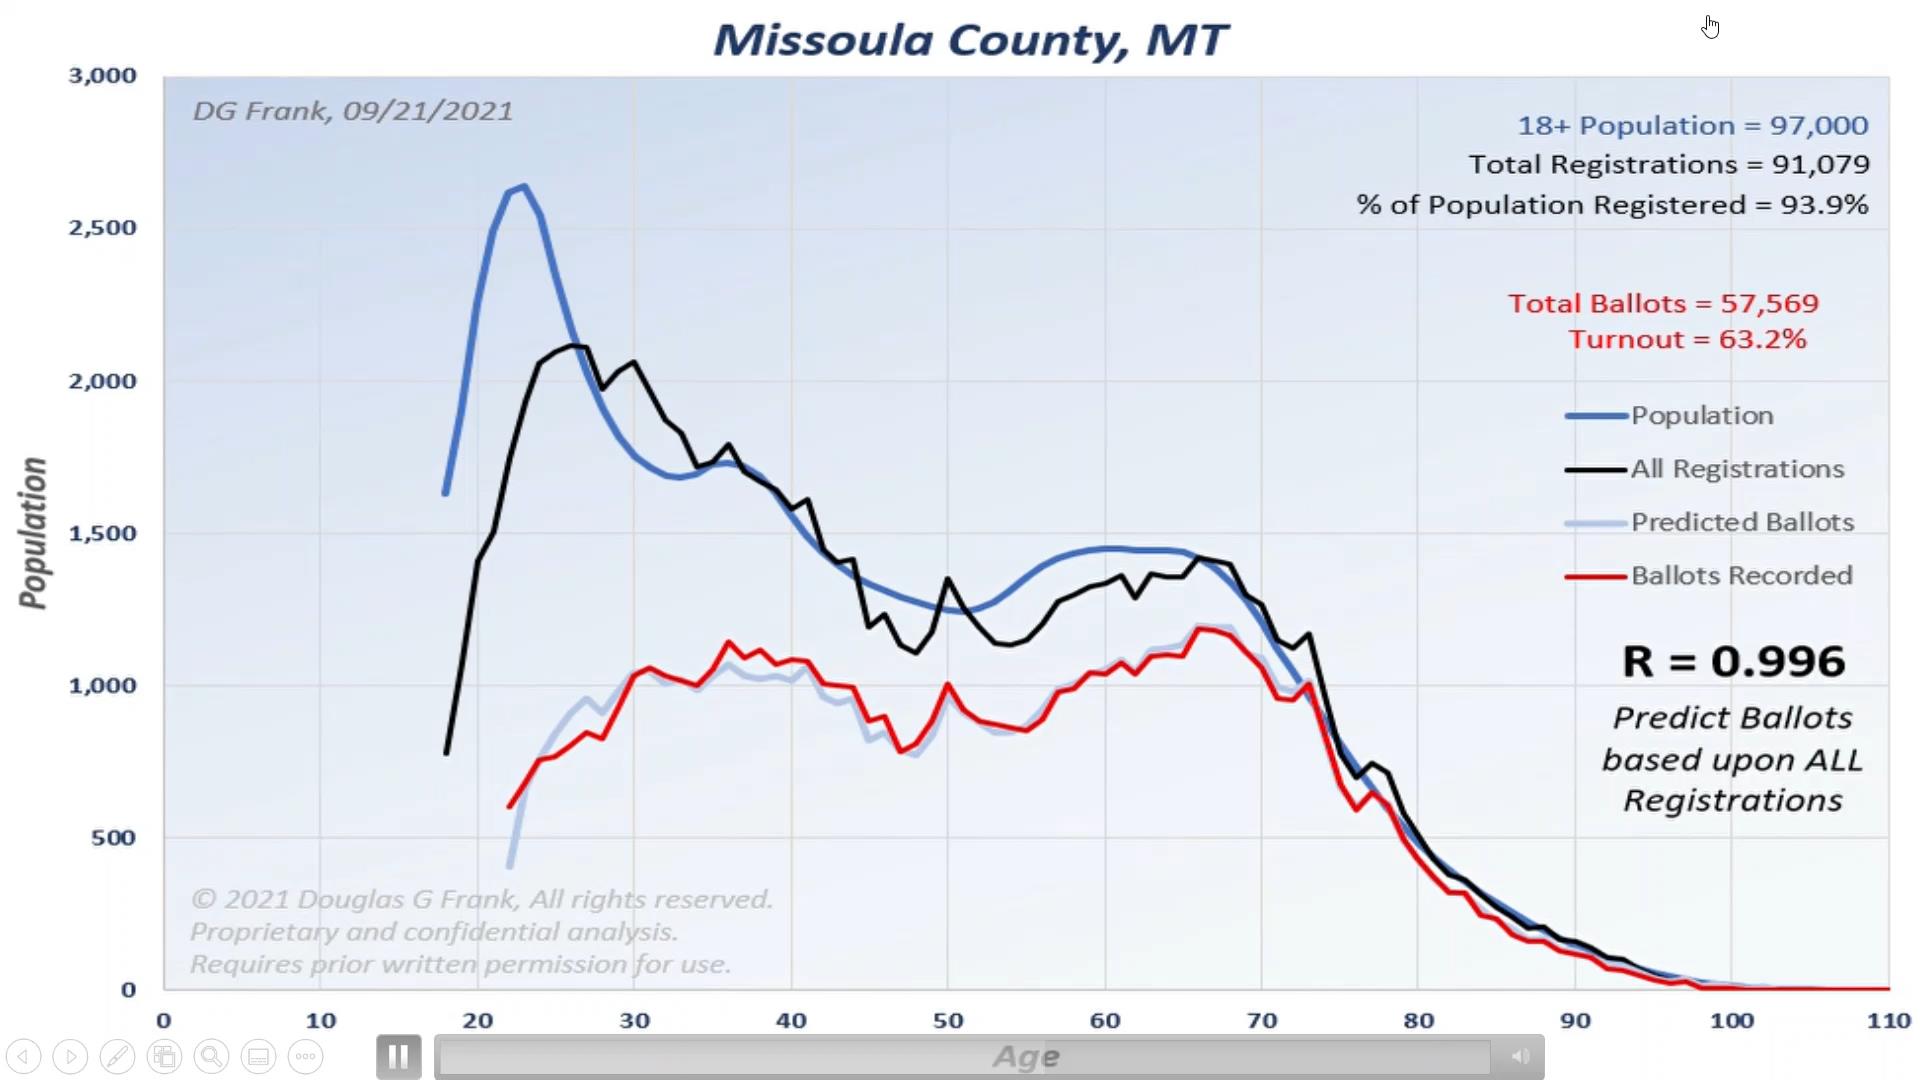
Missoula County election results analysis. Dr. Douglas G. Frank. September 21, 2021.
Blue Line: Population
Black Line: Registered Voters
Red Line: Ballots cast
Light Blue Line: Predicted ballots based on US Census Bureau data combined with Dr. Frank’s algorithm
Notice how closely the red and light blue lines are in alignment.
Counties across Montana had more registered voters in certain age groups than eligible voters exist in the population, and in many cases in older cohorts, voter turnout was nearly 100% and sometimes exceeded the total eligible population.
More astonishingly, the same, exact algorithm (or “key” as Frank calls the mathematical formula) used in Missoula County could be applied to any other county in Montana (except for Petroleum, Treasure, and Wibaux counties) to predict their voter registration and turnout by age, too. See the detailed charts for all of Montana.
Dr. Frank has performed his analysis on at least 14 other states and has found the same disturbing pattern where he is able to predict the voter turnout rate for every age bracket in many counties based only US Census Bureau data.
The following chart shows an overview of each state and how “clean” or “dirty” their voter rolls and turnout numbers appear to be:
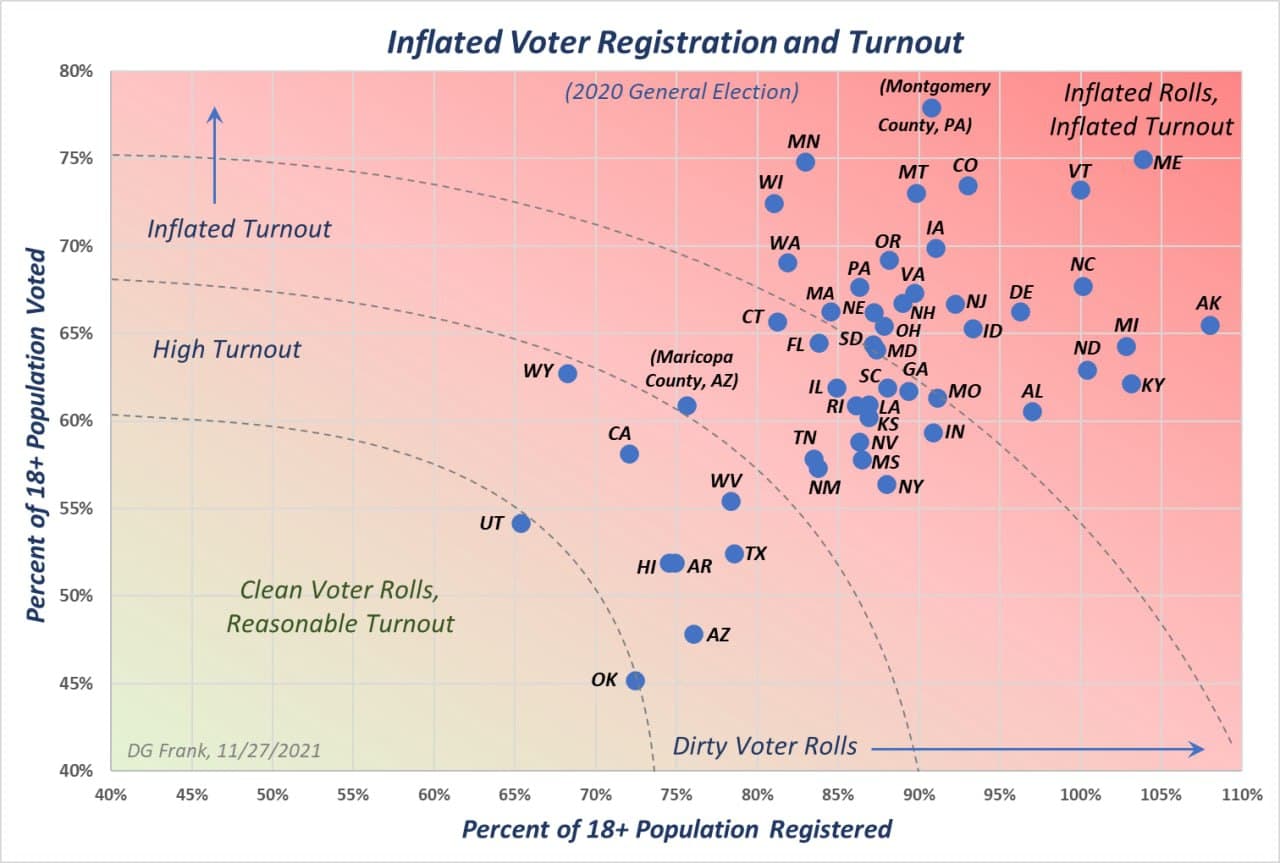
Source: Telegram Post, Nov 28, 2021
Findings By State
| Detailed Charts | Chart Slideshow | Detailed Video | |
|---|---|---|---|
| Alabama | ✔️ | ||
| Arizona | ✔️ | ||
| Colorado | ✔️ | ✔️ | |
| Florida | ✔️ | ||
| Idaho | ✔️ | ||
| Indiana | ✔️ | ||
| Kansas | ✔️ | ✔️ | |
| Kentucky | Some | ✔️ | |
| Michigan | Some | ✔️ | |
| Missouri | ✔️ | ||
| Montana | ✔️ | ||
| Nebraska | ✔️ | ||
| New Jersey | |||
| North Carolina | ✔️ | ✔️ | |
| Ohio | ✔️ | ✔️ | |
| Oregon | |||
| Pennsylvania | ✔️ | ✔️ | ✔️ |
| South Carolina | ✔️ | ||
| Tennessee | ✔️ | ||
| Texas | ✔️ | ||
| Utah | ✔️ | ||
| Washington | ✔️ | ||
| West Virginia | ✔️ | ✔️ | |
| Wisconsin | Some | ✔️ | ✔️ |
State Registration & Turnout Rates Compared
The following chart shows which states have the highest percentage of eligible voters (18 year-olds and above) actually registered to vote, with some states above 100%:
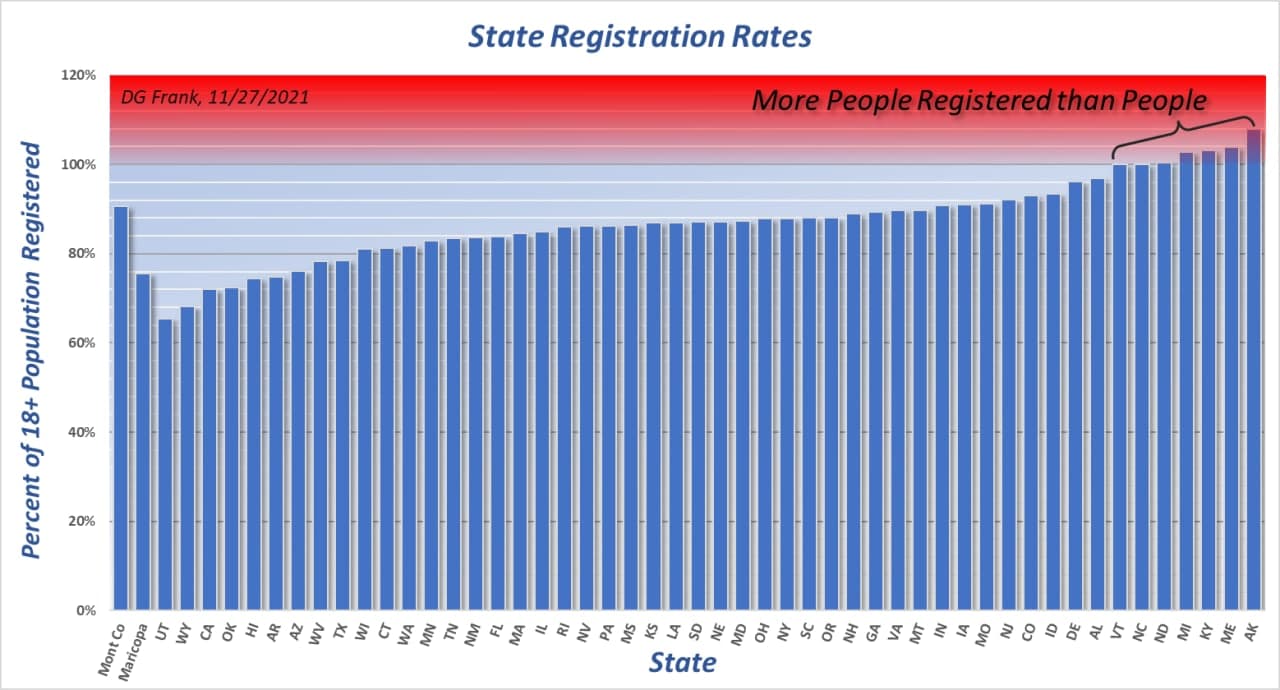
Source: Telegram Post, Nov 28, 2021
This chart shows the states with the highest percentage of registered voters who actually voted in Nov 2020:
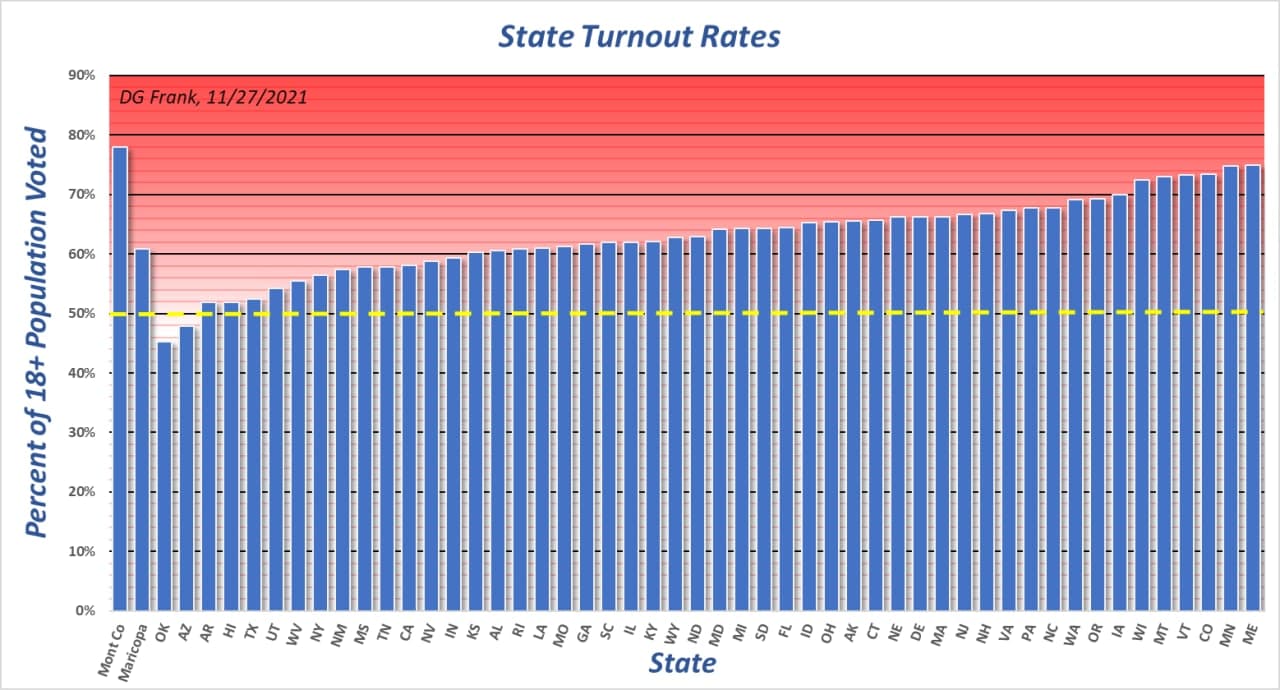
Source: Telegram Post, Nov 28, 2021
By combining the two charts together, we can see which states are really pushing these two strategies heavily:
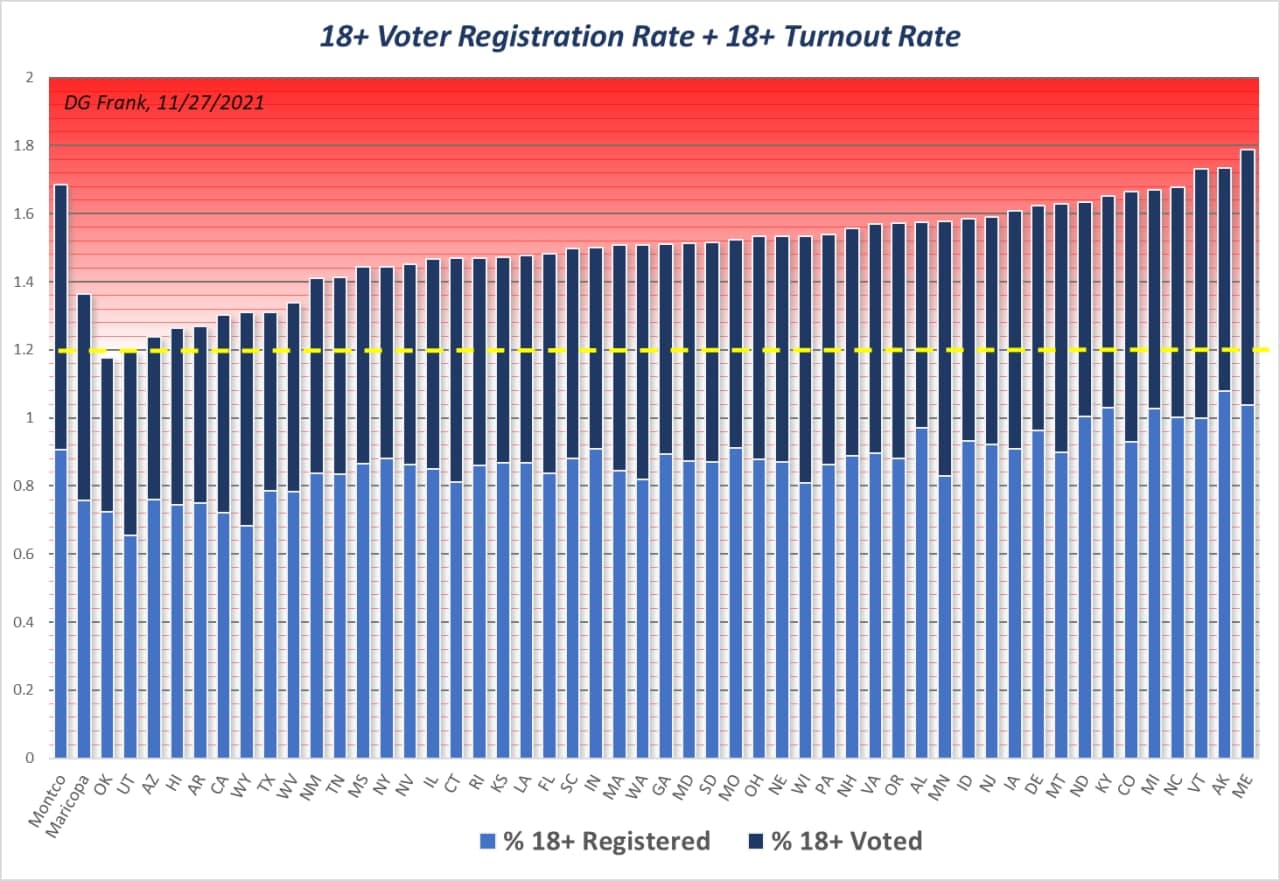
Source: Telegram Post, Nov 28, 2021
Written Reports
Video Presentations
The simplest possible explanation of his findings is covered in this 3min video clip A Simple Metaphor:
A more detailed overview of Dr. Frank’s work can be seen in his 1-hour interview with Mike Lindell, Scientific Proof:
He also presented his findings at Lindell’s Cyber Symposium, Aug 10–12, 2021 (which we covered in another article here):
Other Presentations
-
Introduction to the Key: Dr. Frank — Dr. Frank explains on Frankspeech.com the introduction to the key of the algorithm. Jun 30, 2021.
-
Dr. Frank: Divine Appointments, Algorithms, and Saving the Country One Step at a Time — interview with Professor David Clements, May 21, 2021.
-
Truth & Liberty Coalition Livecast: Dr. Douglas G. Frank on Analyzing the 2020 Election, May 31, 2021 (also on Rumble)
-
Truth & Liberty Coalition Livecast: Dr. Douglas G. Frank on Following the Election Data to Find Evidence, Aug 2, 2021 (also on Rumble)
-
Mike Lindell Cyber Symposium: Dr. Douglas Frank “2020 Election Algorithms”, Aug 11, 2021
-
LINDELL CYBER SYMPOSIUM: Dr. Douglas Frank and Col. Kurt Hyde on Election Fraud and Integrity — interview by The New American, Aug 20, 2021
-
Dr Frank’s Presentation at Washington Election Integrity Public Hearing, Heritage Ranch, Bow WA, Aug 29, 2021
-
Take Back Montana: 2020 Election Analysis — featuring Captain Seth Keshel, Professor David Clements, and Dr. Douglas Frank (from 1hr 53min mark), Sep 25, 2021
-
FrankSpeech Thanks-A-Thon Special Program Joined by Brannon Howse and Dr. Douglas G. Frank, Nov 28, 2021
-
Ann Vandersteel Interviews Dr. Frank, Dec 8, 2021
-
Dr. Frank’s Presentation to Wisconsin Assembly Committee on Campaigns and Elections, Dec 8, 2021 Major Government Hearing
-
Let’s Talk America: Jon Schrock Guest Hosting Featuring Dr. Douglas Frank, Dec 10, 2021
-
Dr. Frank Interview with William Wallis, Dec 14, 2021
-
United States Election Stats (slides only, no sound), Dec 20, 2021
-
United States Election Turnout Presentation (slides only, no sound), Dec 26, 2021
Methodology
An independent researcher demonstrated Dr. Frank’s process and statistics and how he was able to replicate the findings. Watch the video here.
Supreme Court Case
Dr. Douglas Frank publicly confirmed that he is contributing a significant amount of research and data into an upcoming Supreme Court case. In a video interview with Pete Santilli (from 21min mark) he gives more background to the case.
He also suggests that the much-discussed packet captures (PCAPs) that Mike Lindell has been in possession of were actually captured using government (CISA) infrastructure, which is why they were not able to be legally released to the public previously. But they will be included in this upcoming case on November 23.
Get Involved
The upcoming Supreme Court case needs Republican State Attorneys General to sign on as litigants. Let your state representatives know that you want them to support this action.
Follow Dr. Frank’s Updates
Visitor Comments
What are your thoughts on Dr. Frank’s analysis? Or have you found additional materials related to his work that would benefit others? Let us know in the comments below.